Basophils initiate IL-4 production during a memory T-dependent response - PubMed (original) (raw)
Comparative Study
Basophils initiate IL-4 production during a memory T-dependent response
Marat V Khodoun et al. J Exp Med. 2004.
Abstract
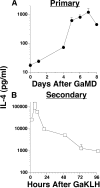
Experiments were performed to characterize and identify the cellular sources of the secondary interleukin (IL)-4 response to a T cell-dependent antigen. Mice were primed by immunization with goat anti-mouse immunoglobulin (Ig)D antibody (GaMD), which stimulates naive CD4+ T cells to secrete IL-4 in 3-4 d. When challenged with goat serum 14 d after immunization, GaMD-primed mice generated an IL-4 response that exceeded the primary response by approximately 100-fold, started in <2 h, and lasted for 4 d. Studies with 4get mice, in which cells with an accessible Il4 gene express a green fluorescent protein (GFP), revealed CD4+ memory T cells, natural killer T cells, basophils, mast cells, and eosinophils as possible rapid producers of IL-4. GFP(+)CD4+ T cells and basophils expanded more in the spleen than the other cell types during the primary response to GaMD. Quantitation of in vivo IL-4 production by the in vivo cytokine capture assay after individual cell types were selectively stimulated or deleted demonstrated that basophils and memory CD4+ T cells account for most of the secondary IL-4 response, with basophils initiating that response through IgE/FcepsilonRI-mediated signaling but secreting IL-4 for <4 h and memory T cells secreting IL-4 within 4 h and continuing to secrete this cytokine for 4 d.
Figures
Figure 1.
Comparison of primary and secondary responses to GaMD. (A) BALB/c mice (5/group in this and other experiments unless otherwise indicated) were left untreated or were immunized i.p. with GaMD. All mice were injected i.v. with 10 μg biotin-BVD4-1D11 anti–IL-4 mAb (BαIL-4) and were bled 1 d later at the time points shown for GaMD-immunized mice. Serum IL-4 levels were determined by IVCCA. Geometric means and SE are shown in this and in subsequent figures. (B) BALB/c mice were immunized with GaMD and challenged with 0.2 ml GaKLH 14 d later. Challenged mice were also injected with BaIL-4 0, 4, 8, 20, 48, 72, or 96 h later and were bled 2 h after that, at the time points shown. Thus, the first point shows IL-4 produced between 0 and 2 h after challenge. IL-4 levels were not determined in this experiment before challenge on day 14, but have been <200 pg/ml in several other experiments.
Figure 2.
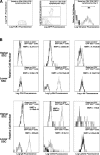
Changes in GFP-expressing spleen cells during the primary response to GaMD in 4get mice. 4get and wild-type mice (4/group) were injected with saline or GaMD and killed 1–14 d later. Spleen cells were stained with combinations of fluorochrome-labeled mAbs to CD3, CD4, CD8, IgE, Ly49b, TCRβ, TCRγ, c-kit, CCR3, and Ly6G/C and with CD1/ α-gal-cer tetramers. Stained cells were analyzed by four-color, dual laser flow cytometry. Histograms show staining with a specific mAb as a fine line; staining with a control mAb or no mAb as a bold line. Gating strategies are shown in Fig. S1. (A) CD4+CD8− spleen cells were analyzed for GFP expression, and GFP+CD4+ cells were analyzed for expression of TCRβ and TCRγ and staining with CD1/α-gal-cer tetramers. The text within the panels indicates gating and time after GaMD immunization. (B) GFP+CD3− spleen cells were analyzed for FSC and side scatter (SSC) of incident light. GFP+CD3− spleen cells with moderate or high SSC were analyzed for expression of surface marker expression. The text within the panels shows normalized median fluorescence intensity of staining (NMFI), defined as (median fluorescence intensity of specifically stained cells) − (median fluorescence intensity of cells not stained with the relevant mAb).
Figure 3.
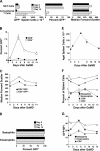
Characterization of GFP+ spleen cells during the primary response to GaMD. Data obtained from the experiments described in Fig. 2 were used to calculate the following. (A) Numbers of GFP+ splenic conventional CD4+ T cells and NKT cells (left), percentages of splenic conventional CD4+ and NKT cells that expressed GFP (middle), and median forward scatter of splenic conventional CD4+ T cells and NKT cells (right). (B) Percentages of CD4+ and CD8+ T cells that expressed GFP. (C) Median FSC of CD4+GFP+ and CD4+GFP− spleen cells. (D) Percentages of splenic basophils and eosinophils that expressed GFP. (E) Total spleen cell number. (F) Percentages of splenic basophils, eosinophils, CD8+ T cells, and CD4+ T cells. (G) Median GFP fluorescence intensity of basophils, eosinophils, and GFP+CD4+ T cells.
Figure 4.
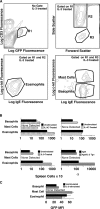
Cytokine effects on spleen cell number and GFP expression in 4get mice. In three separate experiments, 4get mice (4/group) were injected i.v. with saline, IL-3C (10 μg of IL-3 + 50 μg of anti–IL-3 mAb on days 0, 3, and 6), or IL-4C (2 μg IL-4 + 10 μg anti–IL-4 mAb on days 0, 3, and 6), or i.p. with IL-9 (10 μg/d for 7 d). Mice were killed on day 8, and spleen cells from individual mice were counted with a Coulter Counter and stained with fluorochrome-labeled mAbs to CD3, IgE, and c-kit and analyzed by flow cytometry. In a fourth experiment, spleen cells from untreated 4get+/− mice and 4get+/−IL-5 Tgn+/− mice were compared. GFP+c-kitlowIgE−CD3−SSChigh spleen cells were classified as eosinophils; GFP+c-kit−IgE+CD3−SSCintermediate spleen cells were classified as basophils, and GFP+c-kit+IgE+CD3−SSCintermediate spleen cells were classified as mast cells. (A) Gating strategies. (B) Numbers of GFP+ cells of each non–T cell type. Separate groups of control (saline-treated) mice were used for each experiment. Mice differed in age and sex between experiments, explaining modest differences among control groups, but were age and sex matched within each experiment. (C) Median fluorescence intensity of basophil, mast cell, and eosinophil GFP staining in untreated and IL-3–treated mice.
Figure 5.
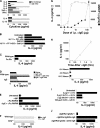
IL-4 secretion during the secondary response to goat serum in GaMD-primed mice. (A) BALB/c mice were immunized with GaMD and injected i.v. 1 or 13 d after GaMD immunization with 1 mg anti-CD4 mAb or control mAb. Mice were challenged with GaKLH on day 14 and injected at the time of challenge with BαIL-4 and bled 4 h later. (B) BALB/c mice were primed with GaMD. Some were injected 13 d later with anti-CD4 mAb and/or i.p. with 200 μg anti-IgE mAb or control mAbs. Mice were left unchallenged or were injected i.p. on day 14 with GaMD or GaKLH and were injected at the same time with BαIL-4 and bled 4 h later. (C) Wild-type or FcɛRI-deficient mice on a BALB/c background were primed with GaMD. Some mice were injected 13 d later with anti-CD4 mAb or control mAb. Mice were challenged on day 14 with saline or GaKLH and injected with BαIL-4 at the time of challenge and bled 2 h later. (D) BALB/c mice were primed with GaMD. Some were injected 13 d later with 200 μg anti-IgE mAb or control mAb. One group was challenged with saline (“time 0” group); all others were challenged with GaKLH on day 14. Saline-challenged mice were injected with BαIL-4 at the time of challenge; GaKLH-challenged mice were injected with BαIL-4 at the time of challenge or 2, 4, 48, or 96 h later. All mice were bled 2 h after BαIL-4 injection. (E) An experiment identical to that described in D was performed, with the exception that some mice were injected on day 13 with 1 mg anti-CD4 mAb or isotype-matched mAb instead of anti-IgE mAb and that an additional group of mice was assayed for IL-4 production 24 h after challenge. (F) Unprimed BALB/c mice were injected on day 0 with anti-CD4 mAb or control mAb. Mice were injected with BαIL-4 ± 10 μg anti-CD3 mAb and bled 2 h later. (G) Wild-type or CD1-deficient mice were immunized with GaMD. All mice were injected with 100 μg anti-IgE mAb 13 d later, challenged with GaKLH, injected with BαIL-4 on day 14, and bled 6 h later. (H) BALB/c mice (5/group) were immunized i.p. with 1 mg OVA/d on days 0–5, treated with saline, 1 mg GK1.5, 200 μg EM-95, or 1 mg GK1.5 + 200 μg EM-95 i.p. on day 13, and challenged i.p. with saline or 2 mg OVA on day 14. All mice were injected with BαIL-4 mAb at the time of challenge and bled 4 h later. Similar results were observed when mice were immunized twice i.p. with OVA/alum and challenged i.p. with soluble OVA (not depicted).
Figure 6.
In vivo cytokine responses to anti-IgE mAb. (A) BALB/c mice were primed with GaMD and challenged 14 d later with anti-IgE mAb. IL-2, IL-3, IL-4, IL-5, IL-13, TNF, and IFN-γ production during the subsequent 24 h were measured by IVCCA. Quantities of different cytokines detected are not comparable; the assays for IL-3 and IL-5 are less efficient than the other assays. (B) BALB/c mice were left unprimed or were primed with GaMD, GaKLH, allo-anti-IgDa mAbs (Hδa/1 and FF1-4D5), or GaKLH + Hδa/1 and FF1-4D5. All mice were challenged 14 d later with anti-IgE mAb and injected at the same time with BαIL-4 and bled 4 h after challenge. (C) Wild-type and FcɛRI-deficient mice on a BALB/c background were primed with GaMD. Mice were challenged 14 d later with 200 μg anti-IgE mAb and injected with BαIL-4 at the same time. Mice were bled 4 h later. (D) Unprimed wild-type and IgE-deficient mice were challenged with anti-IgE mAb or were first injected with IgE and challenged with anti-IgE mAb 1 d later. All mice were injected with BαIL-4 at the time of challenge and bled 24 h later. (E) BALB/c mice were primed with αδ mAbs and challenged 14 d later with anti-IgE mAb, anti-FcγRII/RIII mAb, or anti-IgE + anti-FcγRII/RIII mAb. All mice were injected with BαIL-4 at the time of challenge and bled 3 h later. (F) c-kit–deficient W/Wv mice or age-matched W/+ mice were primed with GaMD and were left unchallenged or were challenged with anti-IgE mAb 14 d later. All mice were injected with BαIL-4 at the time of challenge and were bled 4 h later. (G) BALB/c mice were primed with GaMD and challenged 14 d later with saline or 1–100 μg anti-IgE mAb. All mice were injected with BαIL-4 at the time of challenge and bled 4 h later. Serum MMCP1 levels were determined by ELISA. (H) BALB/c mice were primed with GaMD. (top) Mice were challenged 14 d later with anti-IgE mAb; injected with BαIL-4 2 h, 1 h and 45 min, 1 h and 30 min, or 1 h before challenge or at the time of challenge; and bled 2 h after BαIL-4 injection. (bottom) Mice were challenged with saline or anti-IgE mAb 14 d after priming. Challenged mice were injected with BαIL-4 at the time of challenge or 4 or 8 h later. Mice were bled 4 h after BαIL-4 injection. (I) BALB/c mice were primed with GaMD and challenged 14 d later. Some were challenged with 2 μg anti-IgE mAb and assayed for IL-4 production during the subsequent 4 h. Some mice were initially challenged with 2 μg or 100 μg anti-IgE mAb 12 or 24 h before a second challenge with an additional 100 μg anti-IgE mAb. All mice were injected with 10 μg BαIL-4 at the time of the final challenge and bled 4 h later. (J) BALB/c mice were primed with GaMD. Some were injected with anti-CD4 mAb or a control mAb 12 d later. Mice were left unchallenged or were challenged with anti-IgE mAb on day 14 and were simultaneously injected with BαIL-4 and bled 4 h later. Treatment with anti-CD4 mAb at the time of GaMD priming almost totally blocked the anti-IgE mAb-induced IL-4 response (not depicted).
Figure 7.
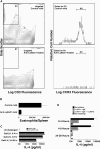
Eosinophil depletion does not inhibit the secondary IL-4 response. BALB/c mice were primed with GaMD and injected 13 d later with 1 mg anti-Ly6G/C or control mAb. Some mice were killed on day 14 and their spleen cells were counted and stained for CD3 and CCR3. (A) Gating strategy. (B) Number of SSChighCCR3+CD3− cells/spleen. (C) Additional mice were left unchallenged or were challenged with GaKLH on day 14, injected with 10 μg BαIL-4 at the time of antigen challenge or 4 or 24 h later and bled 4 h after BαIL-4 injection. (D) Additional mice were treated with saline, anti-CD4 and anti-IgE mAbs, or anti-CD4, anti-IgE, and anti-Ly6C/G mAbs on day 13. Mice were challenged with GaKLH on day 14 or were left unchallenged. IL-4 produced 0–4 h, 4–8 h, and 24–28 h after challenge was determined. ND, not determined.
Similar articles
- IL-12, as an adjuvant, promotes a T helper 1 cell, but does not suppress a T helper 2 cell recall response.
Bliss J, Van Cleave V, Murray K, Wiencis A, Ketchum M, Maylor R, Haire T, Resmini C, Abbas AK, Wolf SF. Bliss J, et al. J Immunol. 1996 Feb 1;156(3):887-94. J Immunol. 1996. PMID: 8558014 - Basophils enhance immunological memory responses.
Denzel A, Maus UA, Rodriguez Gomez M, Moll C, Niedermeier M, Winter C, Maus R, Hollingshead S, Briles DE, Kunz-Schughart LA, Talke Y, Mack M. Denzel A, et al. Nat Immunol. 2008 Jul;9(7):733-42. doi: 10.1038/ni.1621. Epub 2008 May 30. Nat Immunol. 2008. PMID: 18516038 - Basophils produce IL-4 and accumulate in tissues after infection with a Th2-inducing parasite.
Min B, Prout M, Hu-Li J, Zhu J, Jankovic D, Morgan ES, Urban JF Jr, Dvorak AM, Finkelman FD, LeGros G, Paul WE. Min B, et al. J Exp Med. 2004 Aug 16;200(4):507-17. doi: 10.1084/jem.20040590. J Exp Med. 2004. PMID: 15314076 Free PMC article. - IL-1β strikingly enhances antigen-driven CD4 and CD8 T-cell responses.
Ben-Sasson SZ, Wang K, Cohen J, Paul WE. Ben-Sasson SZ, et al. Cold Spring Harb Symp Quant Biol. 2013;78:117-24. doi: 10.1101/sqb.2013.78.021246. Epub 2013 Oct 3. Cold Spring Harb Symp Quant Biol. 2013. PMID: 24092469 Review. - Regulation of IL-4 Expression in Immunity and Diseases.
Ho IC, Miaw SC. Ho IC, et al. Adv Exp Med Biol. 2016;941:31-77. doi: 10.1007/978-94-024-0921-5_3. Adv Exp Med Biol. 2016. PMID: 27734408 Review.
Cited by
- Interleukin-33-activated basophils promote asthma by regulating Th2 cell entry into lung tissue.
Schuijs MJ, Brenis Gomez CM, Bick F, Van Moorleghem J, Vanheerswynghels M, van Loo G, Beyaert R, Voehringer D, Locksley RM, Hammad H, Lambrecht BN. Schuijs MJ, et al. J Exp Med. 2024 Dec 2;221(12):e20240103. doi: 10.1084/jem.20240103. Epub 2024 Sep 19. J Exp Med. 2024. PMID: 39297875 - The origins and longevity of IgE responses as indicated by serological and cellular studies in mice and humans.
Ding Z, Mulder J, Robinson MJ. Ding Z, et al. Allergy. 2023 Dec;78(12):3103-3117. doi: 10.1111/all.15799. Epub 2023 Jul 7. Allergy. 2023. PMID: 37417548 Free PMC article. Review. - Self-reactive IgE and anti-IgE therapy in autoimmune diseases.
Olewicz-Gawlik A, Kowala-Piaskowska A. Olewicz-Gawlik A, et al. Front Pharmacol. 2023 Jan 23;14:1112917. doi: 10.3389/fphar.2023.1112917. eCollection 2023. Front Pharmacol. 2023. PMID: 36755957 Free PMC article. Review. - Embelin Alleviates Severe Airway Inflammation in OVA-LPS-Induced Rat Model of Allergic Asthma.
Azman S, Sekar M, Wahidin S, Gan SH, Vaijanathappa J, Bonam SR, Alvala M, Lum PT, Thakur V, Beladiya JV, Mehta AA. Azman S, et al. J Asthma Allergy. 2021 Dec 15;14:1511-1525. doi: 10.2147/JAA.S298613. eCollection 2021. J Asthma Allergy. 2021. PMID: 34938083 Free PMC article. - Fueling Cancer Immunotherapy With Common Gamma Chain Cytokines.
Dwyer CJ, Knochelmann HM, Smith AS, Wyatt MM, Rangel Rivera GO, Arhontoulis DC, Bartee E, Li Z, Rubinstein MP, Paulos CM. Dwyer CJ, et al. Front Immunol. 2019 Feb 20;10:263. doi: 10.3389/fimmu.2019.00263. eCollection 2019. Front Immunol. 2019. PMID: 30842774 Free PMC article. Review.
References
- Finkelman, F.D., T. Shea-Donohue, J. Goldhill, C.A. Sullivan, S.C. Morris, K.B. Madden, W.C. Gause, and J.F. Urban Jr. 1997. Cytokine regulation of host defense against parasitic gastrointestinal nematodes: lessons from studies with rodent models. Annu. Rev. Immunol. 15:505–533. - PubMed
- Wills-Karp, M., S.H. Gavett, B. Schofield, and F. Finkelman. 1996. Role of interleukin-4 in the development of allergic airway inflammation and airway hyperresponsiveness. Adv. Exp. Med. Biol. 409:343–347. - PubMed
- Paliard, X., R. de Waal Malefijt, H. Yssel, D. Blanchard, I. Chretien, J. Abrams, J. de Vries, and H. Spits. 1988. Simultaneous production of IL-2, IL-4, and IFN-γ by activated human CD4+ and CD8+ T cell clones. J. Immunol. 141:849–855. - PubMed
- Seder, R.A., J.L. Boulay, F. Finkelman, S. Barbier, S.Z. Ben-Sasson, G. Le Gros, and W.E. Paul. 1992. CD8+ T cells can be primed in vitro to produce IL-4. J. Immunol. 148:1652–1656. - PubMed
- Yoshimoto, T., A. Bendelac, C. Watson, J. Hu-Li, and W.E. Paul. 1995. Role of NK1.1+ T cells in a TH2 response and in immunoglobulin E production. Science. 270:1845–1847. - PubMed
Publication types
MeSH terms
Substances
Grants and funding
- R01 AI44971/AI/NIAID NIH HHS/United States
- P01 HL076383/HL/NHLBI NIH HHS/United States
- R01 AI45766/AI/NIAID NIH HHS/United States
- R01 AI055848/AI/NIAID NIH HHS/United States
- R01 AI045766/AI/NIAID NIH HHS/United States
- HL0763833/HL/NHLBI NIH HHS/United States
- R01 AI55848/AI/NIAID NIH HHS/United States
LinkOut - more resources
Full Text Sources
Medical
Research Materials
