A genetic linkage map of the mimetic butterfly Heliconius melpomene - PubMed (original) (raw)
Comparative Study
A genetic linkage map of the mimetic butterfly Heliconius melpomene
Chris D Jiggins et al. Genetics. 2005 Oct.
Abstract
Heliconius melpomene is a mimetic butterfly that exhibits great geographic variation in color pattern. We present here a genetic linkage map based on analysis of genetic markers in 73 individuals from a single F(2) family, offspring of a cross between H. m. cythera from western Ecuador and H. m. melpomene from French Guiana. A novel "three-step method" is described for the analysis of dominant markers in an F(2) cross, using outbred parental strains and taking advantage of the lack of crossing over in female Lepidoptera. This method is likely to prove useful for future mapping studies in outbred species with crossing over restricted to one sex, such as the Lepidoptera and Drosophila. The resulting linkage map has 21 linkage groups corresponding to the 21 chromosomes of H. melpomene and includes 219 AFLP markers, 23 microsatellites, 19 single-copy nuclear genes, and the color pattern switch genes Yb and Sb. The marker density is high, averaging >1/7 cM. The total map length is 1616 cM and the average chromosome length is 77 cM. The genome size of H. melpomene was estimated to be 292 Mb, giving a relationship of physical-to-map distance of 180 kb/cM. This map forms the basis for future comparative linkage analysis of color pattern evolution in Heliconius.
Figures
Figure 1.
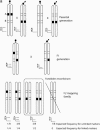
Segregation of markers in an F2 mapping family. (a) The segregation of two markers demonstrating assignment of an F2 locus to a linkage group by the forbidden recombinant method. Two loci are shown: A, inherited as a female-informative locus and corresponding to the chromosome print for this linkage group, and B, a locus that shows a fixed difference between the two parental strains and is inherited as an F2 marker in a 3:1 ratio of band present:band absent in the mapping family. The AFLP banding pattern for the two markers alongside each diploid genotype is shown. Occurrence of forbidden recombinant genotypes, in which both bands are absent, would indicate that the two markers are not syntenic. These genotypes would be expected to occur in one-eighth of the F2 family for unlinked markers. The offspring shown in the box are those that are rescored as missing data for analysis of the recombination map. (b) In more detail, the problem of linkage analysis between dominant markers inherited in repulsion, demonstrated here by loci B and D. Locus C is a male-informative marker that can be used to link B and D into a single map. The first group of progeny, a–f, are informative with respect to linkage of B and C, with c and d being the recombinant genotypes. The second group, g–l, are informative with respect to linkage of C and D. Note that because of dominance, a–f are uninformative with respect to locus D, and g–l are uninformative with respect to locus B.
Figure 2.
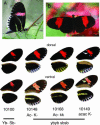
Parental and hybrid phenotypes. (A) H. melpomene cythera (ventral), (B) H. melpomene melpomene (dorsal), and the four major hybrid phenotypic classes. The parental genotypes are ybc ybc sbsb AcAc KK for H. m. cythera and YbYb SbSb acac kk for H. m. melpomene. Note that the phenotypes generated by the loci K and Ac are not expressed in either parental strain.
Figure 3.
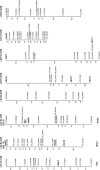
Linkage map of H. melpomene. Microsatellite and SCNP markers are shown in larger type, using standard gene nomenclature for the latter. All remaining markers are AFLPs and are coded with the two selective _Eco_RI nucleotides, followed by the three selective _Mse_I nucleotides, and finally an identifier code; e.g., CT_CAGa38 is band a38 scored from the _Eco_RI-CT _Mse_I-CAG primer combination. Markers assigned to linkage groups for which there is no information on map position are shown separately below the linkage group. Possible homology with linkage groups in H. erato is shown in parentheses below each linkage group number with the H. erato linkage group number; e.g., linkage group 2 (LG2) corresponds to linkage group 13 in H. erato (EG13; see T
obler
et al. 2004) on the basis of the shared Hel.05 marker. These comparisons are based on a single marker in each case so chromosomal homology is tentative. The marker used to establish homology is underlined in each case.
Figure 4.
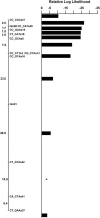
Placement of the color pattern locus Yb on linkage group 15. The log likelihood is shown for placement of the color pattern locus in each mapping interval along the linkage group, relative to the most likely location that is set at zero and is indicated by a star. Values <−2 indicate a significantly worse fit to the data at ∼95%, so placement of the locus in all intervals except for 2 can be ruled out. The Yb locus therefore must be located in the 22-cM interval between the markers CT_GTAa22 and CT_GAAa37.
Similar articles
- Localization of Müllerian mimicry genes on a dense linkage map of Heliconius erato.
Kapan DD, Flanagan NS, Tobler A, Papa R, Reed RD, Gonzalez JA, Restrepo MR, Martinez L, Maldonado K, Ritschoff C, Heckel DG, McMillan WO. Kapan DD, et al. Genetics. 2006 Jun;173(2):735-57. doi: 10.1534/genetics.106.057166. Epub 2006 Feb 19. Genetics. 2006. PMID: 16489214 Free PMC article. - Highly conserved gene order and numerous novel repetitive elements in genomic regions linked to wing pattern variation in Heliconius butterflies.
Papa R, Morrison CM, Walters JR, Counterman BA, Chen R, Halder G, Ferguson L, Chamberlain N, Ffrench-Constant R, Kapan DD, Jiggins CD, Reed RD, McMillan WO. Papa R, et al. BMC Genomics. 2008 Jul 22;9:345. doi: 10.1186/1471-2164-9-345. BMC Genomics. 2008. PMID: 18647405 Free PMC article. - Hybrid incompatibility is consistent with a hybrid origin of Heliconius heurippa Hewitson from its close relatives, Heliconius cydno Doubleday and Heliconius melpomene Linnaeus.
Salazar CA, Jiggins CD, Arias CF, Tobler A, Bermingham E, Linares M. Salazar CA, et al. J Evol Biol. 2005 Mar;18(2):247-56. doi: 10.1111/j.1420-9101.2004.00839.x. J Evol Biol. 2005. PMID: 15715831 - The functional basis of wing patterning in Heliconius butterflies: the molecules behind mimicry.
Kronforst MR, Papa R. Kronforst MR, et al. Genetics. 2015 May;200(1):1-19. doi: 10.1534/genetics.114.172387. Genetics. 2015. PMID: 25953905 Free PMC article. Review. - Genes controlling mimetic colour pattern variation in butterflies.
Nadeau NJ. Nadeau NJ. Curr Opin Insect Sci. 2016 Oct;17:24-31. doi: 10.1016/j.cois.2016.05.013. Epub 2016 May 27. Curr Opin Insect Sci. 2016. PMID: 27720070 Review.
Cited by
- Partial complementarity of the mimetic yellow bar phenotype in Heliconius butterflies.
Maroja LS, Alschuler R, McMillan WO, Jiggins CD. Maroja LS, et al. PLoS One. 2012;7(10):e48627. doi: 10.1371/journal.pone.0048627. Epub 2012 Oct 31. PLoS One. 2012. PMID: 23119074 Free PMC article. - Linkage of butterfly mate preference and wing color preference cue at the genomic location of wingless.
Kronforst MR, Young LG, Kapan DD, McNeely C, O'Neill RJ, Gilbert LE. Kronforst MR, et al. Proc Natl Acad Sci U S A. 2006 Apr 25;103(17):6575-80. doi: 10.1073/pnas.0509685103. Epub 2006 Apr 12. Proc Natl Acad Sci U S A. 2006. PMID: 16611733 Free PMC article. - Polyphyly and gene flow between non-sibling Heliconius species.
Bull V, Beltrán M, Jiggins CD, McMillan WO, Bermingham E, Mallet J. Bull V, et al. BMC Biol. 2006 Apr 21;4:11. doi: 10.1186/1741-7007-4-11. BMC Biol. 2006. PMID: 16630334 Free PMC article. - The genetic architecture of ecological adaptation: intraspecific variation in host plant use by the lepidopteran crop pest Chloridea virescens.
Oppenheim SJ, Gould F, Hopper KR. Oppenheim SJ, et al. Heredity (Edinb). 2018 Mar;120(3):234-250. doi: 10.1038/s41437-017-0016-3. Epub 2017 Dec 14. Heredity (Edinb). 2018. PMID: 29238078 Free PMC article. - Tracing the origin and evolution of supergene mimicry in butterflies.
Zhang W, Westerman E, Nitzany E, Palmer S, Kronforst MR. Zhang W, et al. Nat Commun. 2017 Nov 7;8(1):1269. doi: 10.1038/s41467-017-01370-1. Nat Commun. 2017. PMID: 29116078 Free PMC article.
References
- Beltrán, M., C. D. Jiggins, V. Bull, W. O. McMillan, E. Bermingham et al., 2002. Phylogenetic discordance at the species boundary: gene genealogies in Heliconius butterflies. Mol. Biol. Evol. 19: 2176–2190. - PubMed
- Bennett, M. D., I. J. Leitch, H. J. Price and J. S. Johnston, 2003. Comparisons with Caenorhabditis (∼100 Mb) and Drosophila (∼175 Mb) using flow cytometry show genome size in Arabidopsis to be ∼157 Mb and thus ∼25% larger than the Arabidopsis initiative estimate of ∼125 Mb. Ann. Bot. 91: 547–557. - PMC - PubMed
- Benson, W. W., 1972. Natural selection for Müllerian mimicry in Heliconius erato in Costa Rica. Science 176: 936–939. - PubMed
- Blum, M. J., 2002. Neotropical hybrid zone stability and formation. Ph.D. Thesis, Duke University, Durham, NC.
- Brower, A. V. Z., and E. G. Egan, 1997. Cladistic analysis of Heliconius butterflies and relatives (Nymphalidae: Heliconiiti): a revised phylogenetic position for Eueides based on sequences from mtDNA and a nuclear gene. Proc. R. Soc. Lond. Ser. B 264: 969–977.
Publication types
MeSH terms
Substances
LinkOut - more resources
Full Text Sources
Miscellaneous


