Clues to understanding cold sensation: thermodynamics and electrophysiological analysis of the cold receptor TRPM8 - PubMed (original) (raw)
Clues to understanding cold sensation: thermodynamics and electrophysiological analysis of the cold receptor TRPM8
Sebastian Brauchi et al. Proc Natl Acad Sci U S A. 2004.
Abstract
The cold and menthol receptor, TRPM8, also designated CMR1, is a member of the transient receptor potential (TRP) family of excitatory ion channels. TRPM8 is a channel activated by cold temperatures, voltage, and menthol. In this study, we characterize the cold- and voltage-induced activation of TRPM8 channel in an attempt to identify the temperature- and voltage-dependent components involved in channel activation. Under equilibrium conditions, decreasing temperature has two effects. (i) It shifts the normalized conductance vs. voltage curves toward the left, along the voltage axis. This effect indicates that the degree of order is higher when the channel is in the open configuration. (ii) It increases the maximum channel open probability, suggesting that temperature affects both voltage-dependent and -independent pathways. In the temperature range between 18 degrees C and 25 degrees C, large changes in enthalpy (DeltaH=-112 kcal/mol) and entropy (DeltaS=-384 cal/mol K) accompany the activation process. The Q10 calculated in the same temperature range is 24. This thermodynamic analysis strongly suggests that the process of opening involves large conformational changes of the channel-forming protein. Therefore, the highly temperature-dependent transition between open and closed configurations is possible because enthalpy and entropy are both large and compensate each other. Our data also demonstrate that temperature and voltage interact allosterically to enhance channel opening.
Figures
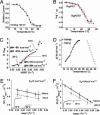
Fig. 2.
Thermodynamic analysis of TRPM8. (A) Current-temperature plot. Each point represents the average of at least seven experiments. Filled symbols represent data obtained with 0.2°C/s temperature ramps. Open symbols correspond to data obtained maintaining the desired temperature constant for at least 60 s and measuring the current at the end of the run. (B) Plot of log(I) vs. T of the data shown in A. (C) van't Hoff plot of the equilibrium constant, K_eq, determined as described in the text. The plot was regressed by using two straight lines in the range between 25°C and 18°C and in the range between 18°C and 10°C. Enthalpies and entropies calculated in these two ranges are shown. (D) Δ_G vs. temperature plot for TRPM8 and TRPV1. Δ_G_ was calculated as RT × ln(_K_eq) for TRPM8 and obtained from Liu et al. (20) for TRPV1. (E) Arrhenius plot for activation process. Activation rates were calculated from the activation time constants of current traces elicited at 160 mV and 70 mV. (F) Arrhenius plot for deactivation process. Deactivation rates were calculated from the deactivation time constants of current traces elicited at -130 mV and -40 mV. (E and F Insets) The time course of the current activation and deactivation at two different temperatures, respectively. Data were fitted to a double exponential function (red dotted lines). Activation energy, _E_a, was calculated directly from the slope of the Arrhenius plots (slope = -_E_a/R) at 160 mV and -130 mV (solid lines).
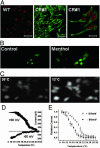
Fig. 1.
TRPM8 cell line expression and functional analysis. (A) Expression of TPRM8 channels in HEK293 cells visualized by using immunofluorescence confocal images (see Methods). Nuclei have been stained with propidium iodide for counterstaining purposes. (Left) The negative control without antibody. (Scale bar in Left and Center,50 μm). The images in Center and Right are from a clone expressing TRPM8 (CR#1). (Right) A magnification in which it is possible to see that the fluorescence is in the membrane and in the cytoplasm. (Scale bar, 20 μm.) (B) Calcium images taken of CR#1 clone cells before (Left) and after (Right) menthol addition (100 μM). (C) Calcium images of CR#1 cells exposed to different temperatures. Cells were loaded with Fluo-4. (D) Current-temperature recordings at holding potentials of -60 and 60 mV. Ramp speed, 0.2°C/s. (E) Normalized current data obtained at -60 and 60 mV. Notice that voltage changes the temperature threshold.
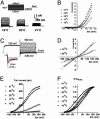
Fig. 3.
Electrophysiological characterization of TRPM8 channels. (A) Whole cell recordings of a cell exposed to the indicated temperatures. The voltage protocol is shown in the top of the figure. (B) Steady-state currents of the recordings shown in A.(C) Instantaneous current protocol for TRPM8. The cell was exposed to a 120-mV depolarizing potential pulse and then pulsed to voltages between 160 and -130 mV in 10-mV increments. Macroscopic tail currents elicited by voltages in the range of -20 to -130 mV were fitted with a double exponential function (red dotted line) to obtain the instantaneous current (Inset). (D) Instantaneous current-voltage plots obtained at 30°C and 14°C. (E) Voltage-activation curves obtained at different temperatures by plotting the tail currents obtained at the indicated voltages. (F) Effect of temperature on the normalized conductance (_G/G_max)-voltage curves. Each point represents the average of at least nine different determinations. In E and F, solid lines are best fits to a Boltzmann function (see text).
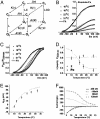
Fig. 4.
Determination of the maximum open probability, , by using variance analysis and single channel current records. (A and B) Plots of variance vs. mean current obtained from whole cell recordings of different cells at different temperatures. Data were fit to a parabola (solid line, Eq. 1) where the single channel amplitude, i, and the number of channels, N, were left as free parameters.
was obtained by using the relationship
. (C) Single channel recordings obtained from the same patch at different temperatures between 20°C and 30°C. Current graphs are shown at right. Red solid lines are fits to the data by using two Gaussians distributions. (D) Open probability, P(O), vs. temperature plot summarizing data from noise analysis and single channel. P(O) values for 29°C, 24°C, and 22°C from single channel data (filled circles) were used for the Boltzmann fitting shown (dashed line). Open circles are
obtained from variance analysis.
Fig. 5.
Fit of averaged P(O)-V curves to an allosteric gating scheme. (A) Allosteric model for activation by voltage and temperature. See text for details. (B) Averaged P(O) (symbols) plotted against voltage for the indicated temperatures. Lines are the simultaneous best fit to Eq. 5.(C) Same data as in A plotted as P(O)/P(O)max. (D) Plot of maximum open probability [P(O)max] and voltage dependency (z) against temperature. (E) Plot of half-activation voltages (_V_0.5) against temperature. In D and E, symbols are experimental data (mean ± SEM) and the continuous line is the prediction from the best fit to Eq. 5. (F) Theoretical current vs. temperature curves for the indicated holding potential, calculated as P(O) × g × V × N. P(O) is the open probability calculated from the model, g is unitary conductance (70 pS), V is membrane holding potential, and N is number of channels (assumed to be 100).
Similar articles
- Biophysical properties of menthol-activated cold receptor TRPM8 channels.
Hui K, Guo Y, Feng ZP. Hui K, et al. Biochem Biophys Res Commun. 2005 Jul 29;333(2):374-82. doi: 10.1016/j.bbrc.2005.05.123. Biochem Biophys Res Commun. 2005. PMID: 15950184 - The principle of temperature-dependent gating in cold- and heat-sensitive TRP channels.
Voets T, Droogmans G, Wissenbach U, Janssens A, Flockerzi V, Nilius B. Voets T, et al. Nature. 2004 Aug 12;430(7001):748-54. doi: 10.1038/nature02732. Nature. 2004. PMID: 15306801 - ThermoTRP channels as modular proteins with allosteric gating.
Latorre R, Brauchi S, Orta G, Zaelzer C, Vargas G. Latorre R, et al. Cell Calcium. 2007 Oct-Nov;42(4-5):427-38. doi: 10.1016/j.ceca.2007.04.004. Epub 2007 May 17. Cell Calcium. 2007. PMID: 17499848 Review. - The super-cooling agent icilin reveals a mechanism of coincidence detection by a temperature-sensitive TRP channel.
Chuang HH, Neuhausser WM, Julius D. Chuang HH, et al. Neuron. 2004 Sep 16;43(6):859-69. doi: 10.1016/j.neuron.2004.08.038. Neuron. 2004. PMID: 15363396 - Thermal gating of TRP ion channels: food for thought?
Liman ER. Liman ER. Sci STKE. 2006 Mar 14;2006(326):pe12. doi: 10.1126/stke.3262006pe12. Sci STKE. 2006. PMID: 16537823 Review.
Cited by
- Temperature acclimation in hot-spring snakes and the convergence of cold response.
Yan C, Wu W, Dong W, Zhu B, Chang J, Lv Y, Yang S, Li JT. Yan C, et al. Innovation (Camb). 2022 Aug 1;3(5):100295. doi: 10.1016/j.xinn.2022.100295. eCollection 2022 Sep 13. Innovation (Camb). 2022. PMID: 36032194 Free PMC article. - Biophysical analysis of thermosensitive TRP channels with a special focus on the cold receptor TRPM8.
Carrasquel-Ursulaez W, Moldenhauer H, Castillo JP, Latorre R, Alvarez O. Carrasquel-Ursulaez W, et al. Temperature (Austin). 2015 May 26;2(2):188-200. doi: 10.1080/23328940.2015.1047558. eCollection 2015 Apr-Jun. Temperature (Austin). 2015. PMID: 27227023 Free PMC article. - Trigeminal Neuralgia TRPM8 Mutation: Enhanced Activation, Basal [Ca2+]i and Menthol Response.
Gualdani R, Yuan JH, Effraim PR, Di Stefano G, Truini A, Cruccu G, Dib-Hajj SD, Gailly P, Waxman SG. Gualdani R, et al. Neurol Genet. 2021 Jan 11;7(1):e550. doi: 10.1212/NXG.0000000000000550. eCollection 2021 Feb. Neurol Genet. 2021. PMID: 33977138 Free PMC article. - Polyester modification of the mammalian TRPM8 channel protein: implications for structure and function.
Cao C, Yudin Y, Bikard Y, Chen W, Liu T, Li H, Jendrossek D, Cohen A, Pavlov E, Rohacs T, Zakharian E. Cao C, et al. Cell Rep. 2013 Jul 25;4(2):302-315. doi: 10.1016/j.celrep.2013.06.022. Epub 2013 Jul 11. Cell Rep. 2013. PMID: 23850286 Free PMC article. - N-terminal tetrapeptide T/SPLH motifs contribute to multimodal activation of human TRPA1 channel.
Hynkova A, Marsakova L, Vaskova J, Vlachova V. Hynkova A, et al. Sci Rep. 2016 Jun 27;6:28700. doi: 10.1038/srep28700. Sci Rep. 2016. PMID: 27345869 Free PMC article.
References
- Caterina, M. J., Schumacher, M. A., Tominaga, M., Rosen, T. A., Levine, J. D. & Julius, D. (1997) Nature 389, 816-824. - PubMed
- Caterina, M. J., Rosen, T. A., Tominaga, M., Brake, A. J. & Julius, D. (1999) Nature 398, 436-441. - PubMed
- Xu, H., Ramsey, I. S., Kotecha, S. A., Moran, M. M., Chong, J. A., Lawson, D., Ge, P., Lilly, J., Silos-Santiago, I., Xie, Y., et al. (2002) Nature 418, 181-186. - PubMed
- McKemy, D. D., Neuhausser, W. M. & Julius, D. (2002) Nature 416, 52-58. - PubMed
Publication types
MeSH terms
Substances
LinkOut - more resources
Full Text Sources
Other Literature Sources
Molecular Biology Databases


