CYP3A variation and the evolution of salt-sensitivity variants - PubMed (original) (raw)
Comparative Study
. 2004 Dec;75(6):1059-69.
doi: 10.1086/426406. Epub 2004 Oct 18.
Affiliations
- PMID: 15492926
- PMCID: PMC1182141
- DOI: 10.1086/426406
Comparative Study
CYP3A variation and the evolution of salt-sensitivity variants
E E Thompson et al. Am J Hum Genet. 2004 Dec.
Abstract
Members of the cytochrome P450 3A subfamily catalyze the metabolism of endogenous substrates, environmental carcinogens, and clinically important exogenous compounds, such as prescription drugs and therapeutic agents. In particular, the CYP3A4 and CYP3A5 genes play an especially important role in pharmacogenetics, since they metabolize >50% of the drugs on the market. However, known genetic variants at these two loci are not sufficient to account for the observed phenotypic variability in drug response. We used a comparative genomics approach to identify conserved coding and noncoding regions at these genes and resequenced them in three ethnically diverse human populations. We show that remarkable interpopulation differences exist with regard to frequency spectrum and haplotype structure. The non-African samples are characterized by a marked excess of rare variants and the presence of a homogeneous group of long-range haplotypes at high frequency. The CYP3A5*1/*3 polymorphism, which is likely to influence salt and water retention and risk for salt-sensitive hypertension, was genotyped in >1,000 individuals from 52 worldwide population samples. The results reveal an unusual geographic pattern whereby the CYP3A5*3 frequency shows extreme variation across human populations and is significantly correlated with distance from the equator. Furthermore, we show that an unlinked variant, AGT M235T, previously implicated in hypertension and pre-eclampsia, exhibits a similar geographic distribution and is significantly correlated in frequency with CYP3A5*1/*3. Taken together, these results suggest that variants that influence salt homeostasis were the targets of a shared selective pressure that resulted from an environmental variable correlated with latitude.
Figures
Figure A1
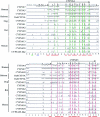
MultiPipMaker plots that illustrate cross-species conservation at CYP3A4 and CYP3A5. The vertical axis ranges between 50% and 100% sequence identity; areas within the plots shaded in light green and pink correspond to the exons of the CYP3A4 and CYP3A5 genes, respectively. Bars below the plots indicate the segments included in the resequencing survey; red bars indicate the sequence included only because of cross-species conservation, green bars indicate the sequence included because of both cross-species conservation and predicted cluster of transcription-factor-binding sites, and blue bars indicate sequences that contain regulatory elements based on prior functional evidence. Numbers on the horizontal axis indicate the position relative to the reference sequence for each gene (GenBank accession numbers AC069294 and AC005020 for CYP3A4 and CYP3A5, respectively).
Figure A2
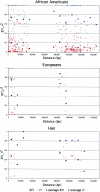
Decay of pairwise LD with distance, as measured by |D′| (blue symbols) and r2 (red symbols) across three human population samples. The blackened circles represent the average values of |D′| (blue) and r2 (red) in 10-kb windows.
Figure 1
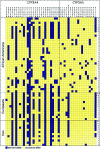
Inferred haplotypes at CYP3A4 and CYP3A5. Neither singleton sites nor multiallelic indels were included. The chimpanzee sequence was used to infer the ancestral allele at each site. The numbers on the right indicate the number of haplotypes in each population. The asterisk (*) indicates the position of CYP3A5*1/*3. Numbers below the gene names indicate the position of each polymorphic site relative to the reference sequence for each gene (GenBank accession numbers AC069294 and AC005020 for CYP3A4 and CYP3A5, respectively).
Figure 2
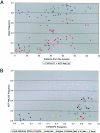
Geographic distribution of the CYP3A5*3 and AGT Met235 allele frequencies. A, Plot of CYP3A5*3 and AGT Met235 allele frequencies and distance from the equator (measured in degrees of latitude). B, Plot of CYP3A5*3 versus AGT Met235 allele frequencies, by subpopulation.
Similar articles
- Sequence diversity and haplotype structure at the human CYP3A cluster.
Thompson EE, Kuttab-Boulos H, Yang L, Roe BA, Di Rienzo A. Thompson EE, et al. Pharmacogenomics J. 2006 Mar-Apr;6(2):105-14. doi: 10.1038/sj.tpj.6500347. Pharmacogenomics J. 2006. PMID: 16314882 - CYP3A4 and CYP3A5 genotyping by Pyrosequencing.
Garsa AA, McLeod HL, Marsh S. Garsa AA, et al. BMC Med Genet. 2005 May 9;6:19. doi: 10.1186/1471-2350-6-19. BMC Med Genet. 2005. PMID: 15882469 Free PMC article. - Genotype-phenotype associations for common CYP3A4 and CYP3A5 variants in the basal and induced metabolism of midazolam in European- and African-American men and women.
Floyd MD, Gervasini G, Masica AL, Mayo G, George AL Jr, Bhat K, Kim RB, Wilkinson GR. Floyd MD, et al. Pharmacogenetics. 2003 Oct;13(10):595-606. doi: 10.1097/00008571-200310000-00003. Pharmacogenetics. 2003. PMID: 14515058 - Functionally defective or altered CYP3A4 and CYP3A5 single nucleotide polymorphisms and their detection with genotyping tests.
Lee SJ, Goldstein JA. Lee SJ, et al. Pharmacogenomics. 2005 Jun;6(4):357-71. doi: 10.1517/14622416.6.4.357. Pharmacogenomics. 2005. PMID: 16004554 Review. - CYP3A4 polymorphisms--potential risk factors for breast and prostate cancer: a HuGE review.
Keshava C, McCanlies EC, Weston A. Keshava C, et al. Am J Epidemiol. 2004 Nov 1;160(9):825-41. doi: 10.1093/aje/kwh294. Am J Epidemiol. 2004. PMID: 15496535 Review.
Cited by
- The MEME Suite.
Bailey TL, Johnson J, Grant CE, Noble WS. Bailey TL, et al. Nucleic Acids Res. 2015 Jul 1;43(W1):W39-49. doi: 10.1093/nar/gkv416. Epub 2015 May 7. Nucleic Acids Res. 2015. PMID: 25953851 Free PMC article. - Clinical Pharmacogenetics Implementation Consortium (CPIC) Guidelines for CYP3A5 Genotype and Tacrolimus Dosing.
Birdwell KA, Decker B, Barbarino JM, Peterson JF, Stein CM, Sadee W, Wang D, Vinks AA, He Y, Swen JJ, Leeder JS, van Schaik R, Thummel KE, Klein TE, Caudle KE, MacPhee IA. Birdwell KA, et al. Clin Pharmacol Ther. 2015 Jul;98(1):19-24. doi: 10.1002/cpt.113. Epub 2015 Jun 3. Clin Pharmacol Ther. 2015. PMID: 25801146 Free PMC article. - Recent advances in understanding the role of nutrition in human genome evolution.
Ye K, Gu Z. Ye K, et al. Adv Nutr. 2011 Nov;2(6):486-96. doi: 10.3945/an.111.001024. Epub 2011 Nov 3. Adv Nutr. 2011. PMID: 22332091 Free PMC article. Review. - Recent and ongoing selection in the human genome.
Nielsen R, Hellmann I, Hubisz M, Bustamante C, Clark AG. Nielsen R, et al. Nat Rev Genet. 2007 Nov;8(11):857-68. doi: 10.1038/nrg2187. Nat Rev Genet. 2007. PMID: 17943193 Free PMC article. Review. - Colloquium paper: human adaptations to diet, subsistence, and ecoregion are due to subtle shifts in allele frequency.
Hancock AM, Witonsky DB, Ehler E, Alkorta-Aranburu G, Beall C, Gebremedhin A, Sukernik R, Utermann G, Pritchard J, Coop G, Di Rienzo A. Hancock AM, et al. Proc Natl Acad Sci U S A. 2010 May 11;107 Suppl 2(Suppl 2):8924-30. doi: 10.1073/pnas.0914625107. Epub 2010 May 5. Proc Natl Acad Sci U S A. 2010. PMID: 20445095 Free PMC article.
References
Electronic-Database Information
- Cluster-Buster, http://zlab.bu.edu/cluster-buster/
- Coriell Cell Repositories, http://locus.umdnj.edu/ccr/
- Di Rienzo Lab Web site, http://genapps.uchicago.edu/labweb/pubs.html (for primer sequences, population sample information, and data)
- GenBank, http://www.ncbi.nlm.nih.gov/Genbank/ (for CYP3A4 [accession number AC069294] and CYP3A5 [accession number AC005020])
- Human Genome Diversity Panel–Centre d’Etude du Polymorphisme Humain (HGDP-CEPH), http://www.cephb.fr/HGDP-CEPH-Panel/
References
- Frantz AG, Katz FH, Jailer JW (1960) 6-β-hydroxy-cortisol: high levels in human urine in pregnancy and toxemia. Proc Soc Exp Biol Med 105:41–43 - PubMed
Publication types
MeSH terms
Substances
Grants and funding
- U01 GM061393/GM/NIGMS NIH HHS/United States
- HG02152/HG/NHGRI NIH HHS/United States
- DK55889/DK/NIDDK NIH HHS/United States
- R01 DK055889/DK/NIDDK NIH HHS/United States
- GM07197/GM/NIGMS NIH HHS/United States
- GM61393/GM/NIGMS NIH HHS/United States
- T32 GM007197/GM/NIGMS NIH HHS/United States
LinkOut - more resources
Full Text Sources
Medical
Research Materials
Miscellaneous


