Normal biogenesis and cycling of empty synaptic vesicles in dopamine neurons of vesicular monoamine transporter 2 knockout mice - PubMed (original) (raw)
Normal biogenesis and cycling of empty synaptic vesicles in dopamine neurons of vesicular monoamine transporter 2 knockout mice
Benjamin G Croft et al. Mol Biol Cell. 2005 Jan.
Abstract
The neuronal isoform of vesicular monoamine transporter, VMAT2, is responsible for packaging dopamine and other monoamines into synaptic vesicles and thereby plays an essential role in dopamine neurotransmission. Dopamine neurons in mice lacking VMAT2 are unable to store or release dopamine from their synaptic vesicles. To determine how VMAT2-mediated filling influences synaptic vesicle morphology and function, we examined dopamine terminals from VMAT2 knockout mice. In contrast to the abnormalities reported in glutamatergic terminals of mice lacking VGLUT1, the corresponding vesicular transporter for glutamate, we found that the ultrastructure of dopamine terminals and synaptic vesicles in VMAT2 knockout mice were indistinguishable from wild type. Using the activity-dependent dyes FM1-43 and FM2-10, we also found that synaptic vesicles in dopamine neurons lacking VMAT2 undergo endocytosis and exocytosis with kinetics identical to those seen in wild-type neurons. Together, these results demonstrate that dopamine synaptic vesicle biogenesis and cycling are independent of vesicle filling with transmitter. By demonstrating that such empty synaptic vesicles can cycle at the nerve terminal, our study suggests that physiological changes in VMAT2 levels or trafficking at the synapse may regulate dopamine release by altering the ratio of fillable-to-empty synaptic vesicles, as both continue to cycle in response to neural activity.
Figures
Figure 1.
Ultrastructure of DA terminals and synaptic vesicles from the striatum of mice lacking VMAT2 appears normal. Representative electron micrographs from the striatum of VMAT2 KO (A and B) and wt (C) mice. The morphology of striatal DA presynaptic terminals and SVs from VMAT2 KO mice was indistinguishable from their wt littermates. Silver-enhanced gold particles indicate TH immunoreactivity, labeling DA neurons. Scale bar, 500 nm.
Figure 2.
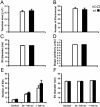
Striatal DA presynaptic terminals and synaptic vesicles are morphologically normal in mice lacking VMAT2. No differences were observed between the VMAT2 KO and wt samples when the ultrastructural features of presynaptic DA terminals were examined. (A) Average area of single sections through TH-positive, presynaptic terminals (VMAT2 KO: 0.314 ± 0.021 μm2, n = 78; wt: 0.330 ± 0.025 μm2, n = 77; not significant [ns]; values represent the mean ± SE of the mean [SEM]); (B) average total number of SV per terminal (VMAT2 KO: 54.3 ± 2.5 n = 78 terminals; wt: 52.2 ± 3.4, n = 77 terminals; ns); based on single sections through individual terminals; (C) average SV diameter (VMAT2 KO: 46.93 ± 0.43 nm, n = 148 SVs; wt: 47.30 ± 0.35 nm, n = 147 SVs; ns); (D) average shape factor of SVs (VMAT2 KO: 0.828 ± 0.002, n = 148 SVs; wt: 0.828 ± 0.002, n = 147 SVs; ns); (E) distribution of SVs at the active zone (VMAT2 KO: 5.6 ± 0.4 docked SVs, 17.3 ± 1.2 SVs between 50 and 150 nm of the active zone and 29.9 ± 5.2 SVs >150 nm from the active zone, n = 15 terminals; wt: 6.3 ± 0.8 docked SVs, 20.2 ± 1.6 SVs between 50 and 150 nm of the active zone and 39.8 ± 6.6 SVs >150 nm from the active zone, n = 15 terminals; ns); (F) SV size according to SV distribution (VMAT2 KO: docked SVs = 44.60 ± 0.70 nm, SVs between 50 and 150 nm of the active zone = 44.35 ± 0.54 nm, SVs >150 nm from the active zone = 45.95 ± 0.57 nm, n = 5 terminals; wt: docked SVs = 44.05 ± 0.91, SVs between 50 and 150 nm of the active zone = 44.58 ± 0.77, SVs >150 nm from the active zone = 46.04 ± 0.53, n = 5 terminals; none of the groups were significantly different from one another); error bars, SEM.
Figure 3.
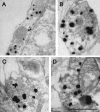
Ultrastructure of synaptic terminals and synaptic vesicles appears normal in DA neurons cultured from mice lacking VMAT2. Representative electron micrographs from midbrain cultures generated from VMAT2 KO (A and B) and wt (C and D) mice. As in the case of the striatal tissue sections, the ultrastructure of TH-positive presynaptic terminals from VMAT2 KO mice was indistinguishable from those derived from wt littermates. Silver-enhanced gold particles indicate TH immunoreactivity, labeling DA neurons. Scale bar, 500 nm
Figure 4.
VGLUT1 and VGLUT2 are not colocalized with TH in cultured midbrain neurons. Representative images of midbrain cultures stained for TH (A and D), VGLUT2 (B), and VGLUT1 (E) showing that TH-positive processes do not express VGLUT2 or VGLUT1. This suggests that the SVs observed in the VMAT2 KO neurons are not filling with glutamate. (C) Merge of A and B; (F) merge of D and E. Scale bar, 20 μm.
Figure 5.
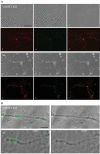
DA neurons lacking VMAT2 display synaptic vesicle exocytosis and endocytosis. (A) Representative images of FM1-43 staining of a cultured neuron derived from a VMAT2 KO (a_-_f) and from a wt littermate (g-l) showing that the SVs of TH-positive cultured midbrain neurons cycle in an activity-dependent manner despite being unable to fill with transmitter. (a and g) Phase contrast image of live neurons. (b and h) Image from panel a or g, respectively, with an overlaid pseudocolor fluorescent image of FM1-43 staining. (c and i) Image from panel a or g, respectively, with an overlaid pseudocolored image of the same neuron after FM1-43 destaining. After staining and destaining, the cultures were fixed and immunostained for TH (d and j) and synaptophysin (e and k). (f and l) The merged images of d and e and j and k, respectively (TH in red and synaptophysin in green). Synaptophysin staining colocalizes with TH-positive neurons and localized extensively to areas of FM1-43 uptake. Scale bar, 100 μm. (B) Higher magnification images of single neurites from TH-positive neurons derived from a VMAT2 KO (a and b) and a wt mouse (c and d) showing stimulation dependent FM1-43 staining (a and c) and destaining (b and d). Scale bar, 10 μm. Note that the FM1-43-stained and -destained images were processed identically to one another for each field: the pseudo-colored overlays were generated by highlighting all fluorescence brighter than a threshold set slightly above the background fluorescence of the FM1-43-stained image.
Figure 6.
Specificity of FM1-43 staining in cultured neurons. (A) Mock-staining: A representative phase contrast image of a neuron (a) from a culture that was exposed to FM1-43 in the absence of depolarization. The neuron did not demonstrate any nonspecific FM1-43 fluorescence (b). Subsequent FM1-43 staining (c) and destaining (d) of the same neuron confirmed its viability. (B) Mock-destaining: a representative phase contrast image of a neuron (a) from a culture showing that FM1-43 fluorescence did not decrease nonspecifically during the course of the uptake experiment (b = 2 min; c = 30 min) but decreased rapidly after exposure to high-potassium buffer (d). (C) Residual FM1-43: A representative phase contrast image of a neuron (a) from a culture that was stained with FM1-43 (b; red) and immediately processed for TH immunofluorescence (c; green) showing that FM1-43 did not produce any residual fluorescence (d; red). Scale bar, 10 μm.
Figure 7.
DA neurons from VMAT2 KO mice display the same SV cycling kinetics as those derived from wt mice. The rate of FM2-10 destaining in TH-positive neurons, as measured by the decrease in fluorescence intensity over time after electrical field stimulation, is shown. No differences were seen between TH-positive neurons derived from VMAT2 KO compared with those from derived from wt mice. One hundred ten terminals from 5 VMAT2 KO neurons and 86 terminals from 4 wt neurons were examined. Error bars, SEM.
Similar articles
- Vesicular monoamine and glutamate transporters select distinct synaptic vesicle recycling pathways.
Onoa B, Li H, Gagnon-Bartsch JA, Elias LA, Edwards RH. Onoa B, et al. J Neurosci. 2010 Jun 9;30(23):7917-27. doi: 10.1523/JNEUROSCI.5298-09.2010. J Neurosci. 2010. PMID: 20534840 Free PMC article. - Presynaptic control of striatal dopamine neurotransmission in adult vesicular monoamine transporter 2 (VMAT2) mutant mice.
Patel J, Mooslehner KA, Chan PM, Emson PC, Stamford JA. Patel J, et al. J Neurochem. 2003 May;85(4):898-910. doi: 10.1046/j.1471-4159.2003.01732.x. J Neurochem. 2003. PMID: 12716422 - Regulation of dopamine quantal size in midbrain and hippocampal neurons.
Pothos EN. Pothos EN. Behav Brain Res. 2002 Mar 10;130(1-2):203-7. doi: 10.1016/s0166-4328(01)00419-3. Behav Brain Res. 2002. PMID: 11864736 - Electron microscopic immunolabeling of transporters and receptors identifies transmitter-specific functional sites envisioned in Cajal's neuron.
Pickel VM, Garzón M, Mengual E. Pickel VM, et al. Prog Brain Res. 2002;136:145-55. doi: 10.1016/s0079-6123(02)36014-x. Prog Brain Res. 2002. PMID: 12143378 Review. - Dopamine transporters and neuronal injury.
Miller GW, Gainetdinov RR, Levey AI, Caron MG. Miller GW, et al. Trends Pharmacol Sci. 1999 Oct;20(10):424-9. doi: 10.1016/s0165-6147(99)01379-6. Trends Pharmacol Sci. 1999. PMID: 10498956 Review.
Cited by
- Monitoring synaptic function at the neuromuscular junction of a mouse expressing synaptopHluorin.
Tabares L, Ruiz R, Linares-Clemente P, Gaffield MA, Alvarez de Toledo G, Fernandez-Chacón R, Betz WJ. Tabares L, et al. J Neurosci. 2007 May 16;27(20):5422-30. doi: 10.1523/JNEUROSCI.0670-07.2007. J Neurosci. 2007. PMID: 17507564 Free PMC article. - In vivo overexpression of synaptogyrin-3 promotes striatal synaptic dopamine uptake in LRRK2R1441G mutant mouse model of Parkinson's disease.
Ho PW, Li L, Liu HF, Choi ZY, Chang EES, Pang SY, Malki Y, Leung CT, Kung MH, Ramsden DB, Ho SL. Ho PW, et al. Brain Behav. 2023 Feb;13(2):e2886. doi: 10.1002/brb3.2886. Epub 2023 Jan 9. Brain Behav. 2023. PMID: 36624932 Free PMC article. - Reduced expression of the vesicular acetylcholine transporter and neurotransmitter content affects synaptic vesicle distribution and shape in mouse neuromuscular junction.
Rodrigues HA, Fonseca Mde C, Camargo WL, Lima PM, Martinelli PM, Naves LA, Prado VF, Prado MA, Guatimosim C. Rodrigues HA, et al. PLoS One. 2013 Nov 8;8(11):e78342. doi: 10.1371/journal.pone.0078342. eCollection 2013. PLoS One. 2013. PMID: 24260111 Free PMC article. - Effect of levodopa priming on dopamine neuron transplant efficacy and induction of abnormal involuntary movements in parkinsonian rats.
Steece-Collier K, Soderstrom KE, Collier TJ, Sortwell CE, Maries-Lad E. Steece-Collier K, et al. J Comp Neurol. 2009 Jul 1;515(1):15-30. doi: 10.1002/cne.22037. J Comp Neurol. 2009. PMID: 19399877 Free PMC article. - Exercise protects against MPTP-induced neurotoxicity in mice.
Gerecke KM, Jiao Y, Pani A, Pagala V, Smeyne RJ. Gerecke KM, et al. Brain Res. 2010 Jun 23;1341:72-83. doi: 10.1016/j.brainres.2010.01.053. Epub 2010 Jan 29. Brain Res. 2010. PMID: 20116369 Free PMC article.
References
- Bergevin, A., Girardot, D., Bourque, M. J., and Trudeau, L. E. (2002). Presynaptic mu-opioid receptors regulate a late step of the secretory process in rat ventral tegmental area GABAergic neurons. Neuropharmacology 42, 1065-1078. - PubMed
- Bourque, M. J., and Trudeau, L. E. (2000). GDNF enhances the synaptic efficacy of dopaminergic neurons in culture. Eur. J. Neurosci. 12, 3172-3180. - PubMed
Publication types
MeSH terms
Substances
LinkOut - more resources
Full Text Sources
Other Literature Sources
Molecular Biology Databases


