Probing microRNAs with microarrays: tissue specificity and functional inference - PubMed (original) (raw)
Comparative Study
Probing microRNAs with microarrays: tissue specificity and functional inference
Tomas Babak et al. RNA. 2004 Nov.
Erratum in
- RNA. 2005 Jan;11(1):114
Abstract
MicroRNAs (miRNAs) are short, stable, noncoding RNAs involved in post-transcriptional gene silencing via hybridization to mRNA. Few have been thoroughly characterized in any species. Here, we describe a method to detect miRNAs using micro-arrays, in which the miRNAs are directly hybridized to the array. We used this method to analyze miRNA expression across 17 mouse organs and tissues. More than half of the 78 miRNAs detected were expressed in specific adult tissues, suggesting that miRNAs have widespread regulatory roles in adults. By comparing miRNA levels to mRNA levels determined in a parallel microarray analysis of the same tissues, we found that the expression of target mRNAs predicted on the basis of sequence complementarity is unrelated to the tissues in which the corresponding miRNA is expressed.
Figures
FIGURE 1.
Detection of miRNAs by microarrays. Total RNA extracted from brain and liver was covalently labeled with Cy3 (green channel) and Cy5 (red channel), respectively, and hybridized to the array. The same RNAs, in addition to five others, were analyzed by Northern blotting (shown at right). The scanner counts are background-subtracted; median values for tRNA and rRNA positive control spots on the same arrays were ~100 and ~25,000, respectively. A sample image of an entire Northern blot is available in Supplemental Figure S1 (see Supplemental Material at
http://hugheslab.med.utoronto.ca/Babak
).
FIGURE 2.
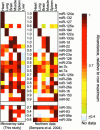
MicroRNA microarray data from directly labeled miRNA agree with previously published Northern analyses (Sempere et al. 2004). Shown are all miRNAs detected using microarrays in this study (left) at a signal threshold >99% that of negative control probes in at least one tissue, and by Northern analysis in a previous study (Sempere et al. 2004) with a cutoff signal/background ratio of 1.3 (right) (L. Sempere and V. Ambros, pers. comm.). Within each study, the rows were normalized to a maximum value of 1 to allow direct comparison of the data sets. More than 95% of the normalized values between 0 and 0.4 were zero. The numbers between the two panels are the _r_-values of the Pearson correlation for each miRNA between the two studies.
FIGURE 3.
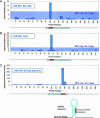
MicroRNA microarray probes distinguish mature miRNAs from flanking sequence. Probes were tiled every 7 nt across miRNA-precursors including 100-nt 5′- and 3′-flanking genomic sequence on both ends. (A) miR-201 profile from RNA extracted from ES cells; (B) miR-30a profile from RNA extracted from lung; (C) miR-183 profile from RNA extracted from 9.5-d placenta. Shaded regions indicate the intensity range of 99% negative control measurements (200 random sequences per array, compounded over 17 experiments).
FIGURE 4.
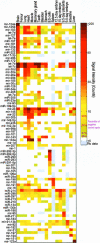
Expression profiles of 78 miRNAs across 17 mouse tissues reveal tissue-specific expression of the majority of miRNAs detected. Expression data were subset to miRNAs with a signal threshold >99% of the negative control probes in at least one tissue. The intensity scale represents background-subtracted normalized scanner intensity counts, with the negative control probe thresholds indicated.
FIGURE 5.
mRNAs are not biased toward being expressed in the same tissues as miRNAs that are predicted to target them. The expression overlap between each sequence-predicted miRNA–mRNA target pair was calculated using Jaccard’s similarity coefficient and then averaged over all targets for that miRNA. This was repeated for the same number of randomly selected targets with an equal expression distribution (each target was replaced by a randomly selected target expressed in the same number of tissues). (A) The predicted target overlap scores are plotted versus overlap scores of randomly selected target scores. Of the Miranda-predicted targets, 55% had a better overlap with predicted targets than randomly selected targets (these fell above the line; using full-sequence RefSeq genes, default settings, shuffling enabled, _z_Miranda > 5). Similarly, 56% of TargetScan-predicted targets had a better overlap with predicted targets than randomly selected targets (full-sequence RefSeq genes, default settings, _z_TargetScan > 4; higher z thresholds did not improve the overlap). Restricting targets to conserved 3′-UTRs did not visibly improve the overlap (Miranda results shown). (B) The same analysis was performed using two sets of randomly selected targets to demonstrate the degree of variability that arises from random resampling.
Similar articles
- Development of a micro-array to detect human and mouse microRNAs and characterization of expression in human organs.
Sun Y, Koo S, White N, Peralta E, Esau C, Dean NM, Perera RJ. Sun Y, et al. Nucleic Acids Res. 2004 Dec 22;32(22):e188. doi: 10.1093/nar/gnh186. Nucleic Acids Res. 2004. PMID: 15616155 Free PMC article. - Target identification of microRNAs expressed highly in human embryonic stem cells.
Li SS, Yu SL, Kao LP, Tsai ZY, Singh S, Chen BZ, Ho BC, Liu YH, Yang PC. Li SS, et al. J Cell Biochem. 2009 Apr 15;106(6):1020-30. doi: 10.1002/jcb.22084. J Cell Biochem. 2009. PMID: 19229866 - Expression of microRNAs and their target mRNAs in human stem cell-derived cardiomyocyte clusters and in heart tissue.
Synnergren J, Améen C, Lindahl A, Olsson B, Sartipy P. Synnergren J, et al. Physiol Genomics. 2011 May 1;43(10):581-94. doi: 10.1152/physiolgenomics.00074.2010. Epub 2010 Sep 14. Physiol Genomics. 2011. PMID: 20841501 - Analyzing micro-RNA expression using microarrays.
Davison TS, Johnson CD, Andruss BF. Davison TS, et al. Methods Enzymol. 2006;411:14-34. doi: 10.1016/S0076-6879(06)11002-2. Methods Enzymol. 2006. PMID: 16939783 Review. - Monitoring the spatiotemporal activities of miRNAs in small animal models using molecular imaging modalities.
Baril P, Ezzine S, Pichon C. Baril P, et al. Int J Mol Sci. 2015 Mar 4;16(3):4947-72. doi: 10.3390/ijms16034947. Int J Mol Sci. 2015. PMID: 25749473 Free PMC article. Review.
Cited by
- Antiquity of microRNAs and their targets in land plants.
Axtell MJ, Bartel DP. Axtell MJ, et al. Plant Cell. 2005 Jun;17(6):1658-73. doi: 10.1105/tpc.105.032185. Epub 2005 Apr 22. Plant Cell. 2005. PMID: 15849273 Free PMC article. - Evaluation of a new high-dimensional miRNA profiling platform.
Cunningham JM, Oberg AL, Borralho PM, Kren BT, French AJ, Wang L, Bot BM, Morlan BW, Silverstein KA, Staggs R, Zeng Y, Lamblin AF, Hilker CA, Fan JB, Steer CJ, Thibodeau SN. Cunningham JM, et al. BMC Med Genomics. 2009 Aug 27;2:57. doi: 10.1186/1755-8794-2-57. BMC Med Genomics. 2009. PMID: 19712457 Free PMC article. - MicroRNA expression in Alzheimer blood mononuclear cells.
Schipper HM, Maes OC, Chertkow HM, Wang E. Schipper HM, et al. Gene Regul Syst Bio. 2007 Dec 20;1:263-74. doi: 10.4137/grsb.s361. Gene Regul Syst Bio. 2007. PMID: 19936094 Free PMC article. - Identification of rat lung-specific microRNAs by micoRNA microarray: valuable discoveries for the facilitation of lung research.
Wang Y, Weng T, Gou D, Chen Z, Chintagari NR, Liu L. Wang Y, et al. BMC Genomics. 2007 Jan 24;8:29. doi: 10.1186/1471-2164-8-29. BMC Genomics. 2007. PMID: 17250765 Free PMC article. - Comparative profiling of miRNA expression in developing seeds of high linoleic and high oleic safflower (Carthamus tinctorius L.) plants.
Cao S, Zhu QH, Shen W, Jiao X, Zhao X, Wang MB, Liu L, Singh SP, Liu Q. Cao S, et al. Front Plant Sci. 2013 Dec 2;4:489. doi: 10.3389/fpls.2013.00489. eCollection 2013. Front Plant Sci. 2013. PMID: 24348492 Free PMC article.
References
- Bartel, D.P. 2004. MicroRNAs: Genomics, biogenesis, mechanism, and function. Cell 116: 281–297. - PubMed
Publication types
MeSH terms
Substances
LinkOut - more resources
Full Text Sources
Other Literature Sources
Molecular Biology Databases


