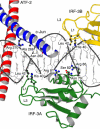
Crystal structure of ATF-2/c-Jun and IRF-3 bound to the interferon-beta enhancer - PubMed (original) (raw)
Crystal structure of ATF-2/c-Jun and IRF-3 bound to the interferon-beta enhancer
Daniel Panne et al. EMBO J. 2004.
Abstract
Transcriptional activation of the interferon-beta (IFN-beta) gene requires assembly of an enhanceosome containing the transcription factors ATF-2/c-Jun, IRF-3/IRF-7, NF-kappaB and HMGI(Y). These factors cooperatively bind a composite DNA site and activate expression of the IFN-beta gene. The 3.0 A crystal structure of the DNA-binding domains of ATF-2/c-Jun and two IRF-3 molecules in a complex with 31 base pairs (bp) of the PRDIV-PRDIII region of the IFN-beta enhancer shows that association of the four proteins with DNA creates a continuous surface for the recognition of 24 bp. The structure, together with in vitro binding studies and protein mutagenesis, shows that protein-protein interactions are not critical for cooperative binding. Instead, cooperativity arises mainly through nucleotide sequence-dependent structural changes in the DNA that allow formation of complementary DNA conformations. Because the binding sites overlap on the enhancer, the unit of recognition is the entire nucleotide sequence, not the individual subsites.
Figures
Figure 1
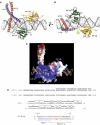
The ATF-2/c-Jun–IRF-3–DNA complex (drawn with MOLSCRIPT; Kraulis, 1991). ATF-2 is red, c-Jun is blue, IRF-3 domain A is green and IRF-3 domain B is yellow. (A, B) Two views of the complex, related by 90°, showing the proximity of the ATF-2/c-Jun heterodimer to loops L1 and L3 of IRF-3A and IRF-3B. (C) Electrostatic surface potential of the DNA-bound ATF-2/c-Jun/IRF-3 complex calculated with GRASP (Nicholls et al, 1991). The color scheme indicates the electrostatic potential from −10 to +10_k_B_T_, where _k_B is the Boltzmann constant and T is the temperature (blue, positive; red, negative). The orientation is as in (A). (D) Amino-acid sequences of the ATF-2, c-Jun, IRF-3 constructs, and of the 31 bp double-helical DNA fragment used in crystallization. Letters a–e above the ATF-2 sequence indicate the heptad repeat of the leucine zipper. Amino-acid numbering corresponds to the human protein sequences. The DNA sequence corresponds to the PRDIV–III region (−102 to −72 nucleotides from the start site of transcription) of the IFN-β enhancer. The core binding sequences are in red (IRF-3A and IRF-3B) and in blue for ATF-2/c-Jun.
Figure 2
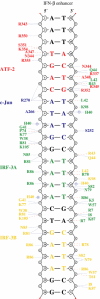
Protein–DNA contacts. Schematic diagram of protein–DNA contacts generated using NUCPLOT (Luscombe et al, 1997). Residues from ATF-2 are in red, c-Jun in blue, IRF-3A in green and IRF-3B in yellow. The core binding sites for each protein are indicated in the corresponding colors. Blue lines indicate hydrogen bonds and red lines van der Waals contacts. Note that contacts by His 40 of IRF-3A and IRF-3B are water mediated.
Figure 3
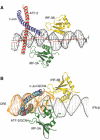
(A) Side view of the complex showing bending of the DNA around the IRF-3A and IRF-3B domains. The red line shows the local helical axis and the black line a straight overall helical axis fit as calculated with the program Curves (Lavery and Sklenar, 1988). (B) Superposition of Cα residues in the leucine zipper region of ATF-2/c-Jun with those of GCN4 bound to a CRE binding site (1DGC.pdb). The superposed structure is rotated about 90° and viewed from below to reveal the conformational differences in the DNA of the two structures. The GCN4 α helices are shown in cyan and the DNA from the GCN4/CRE complex is shown in orange.
Figure 4
EMSA comparing ATF-2/c-Jun and IRF-3 binding to the 31-mer DNA duplex used for crystallization. The DNA contains either the wild-type interferon-β enhancer 5′-TGACATAG-3′ (left) or the CRE 5′-TGACGTCA-3′ variant (right). In lanes 6–12 and 13–17, 20 μM ATF-2/c-Jun heterodimer was preincubated with 20 μM substrate DNA for 10 min before addition of increasing concentrations of IRF-3 dimer. In lanes 1–5, IRF-3 dimer was mixed directly with 20 μM substrate DNA. IRF-3 dimer concentrations were 30 μM (lanes 5 and 12), 18 μM (lanes 4 and 11), 12 μM (lanes 3 and 10), 8 μM (lanes 2 and 9), 5.5 μM (lanes 1 and 8) and 3.6 μM (lane 7). On the CRE site substrate, IRF-3 dimer concentrations were 3, 6, 12 and 24 μM (lanes 14–17). ATF-2/c-Jun alone bound to the wild-type or CRE sequence is shown in lanes 6 and 13, respectively. Note that at the highest IRF-3 dimer concentrations, an extra band probably corresponding to binding of a second IRF-3 dimer appears (lanes 5 and 12).
Figure 5
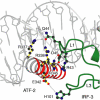
The ATF-2/IRF-3 interface. ATF-2 is red, IRF-3 domain A is green and DNA is in gray. Residues in the interface that were tested by mutagenesis are shown.
Figure 6
Overlapping DNA contacts. Loop L1 of IRF-3A inserts into the minor groove opposite c-Jun, and loop L1 from IRF-3B inserts opposite to helix α3 of IRF-3A.
Similar articles
- Assembly of a functional beta interferon enhanceosome is dependent on ATF-2-c-jun heterodimer orientation.
Falvo JV, Parekh BS, Lin CH, Fraenkel E, Maniatis T. Falvo JV, et al. Mol Cell Biol. 2000 Jul;20(13):4814-25. doi: 10.1128/MCB.20.13.4814-4825.2000. Mol Cell Biol. 2000. PMID: 10848607 Free PMC article. - Assembling the human IFN-beta enhanceosome in solution.
Dragan AI, Carrillo R, Gerasimova TI, Privalov PL. Dragan AI, et al. J Mol Biol. 2008 Dec 12;384(2):335-48. doi: 10.1016/j.jmb.2008.09.015. Epub 2008 Sep 16. J Mol Biol. 2008. PMID: 18823997 - The role of HMG I(Y) in the assembly and function of the IFN-beta enhanceosome.
Yie J, Merika M, Munshi N, Chen G, Thanos D. Yie J, et al. EMBO J. 1999 Jun 1;18(11):3074-89. doi: 10.1093/emboj/18.11.3074. EMBO J. 1999. PMID: 10357819 Free PMC article. - The enhanceosome.
Panne D. Panne D. Curr Opin Struct Biol. 2008 Apr;18(2):236-42. doi: 10.1016/j.sbi.2007.12.002. Epub 2008 Feb 21. Curr Opin Struct Biol. 2008. PMID: 18206362 Review. - Enhancement and diversification of IFN induction by IRF-7-mediated positive feedback.
Levy DE, Marié I, Smith E, Prakash A. Levy DE, et al. J Interferon Cytokine Res. 2002 Jan;22(1):87-93. doi: 10.1089/107999002753452692. J Interferon Cytokine Res. 2002. PMID: 11846979 Review.
Cited by
- Functional anatomy of distant-acting mammalian enhancers.
Dickel DE, Visel A, Pennacchio LA. Dickel DE, et al. Philos Trans R Soc Lond B Biol Sci. 2013 May 6;368(1620):20120359. doi: 10.1098/rstb.2012.0359. Print 2013. Philos Trans R Soc Lond B Biol Sci. 2013. PMID: 23650633 Free PMC article. Review. - Overlapping ETS and CRE Motifs ((G/C)CGGAAGTGACGTCA) preferentially bound by GABPα and CREB proteins.
Chatterjee R, Zhao J, He X, Shlyakhtenko A, Mann I, Waterfall JJ, Meltzer P, Sathyanarayana BK, FitzGerald PC, Vinson C. Chatterjee R, et al. G3 (Bethesda). 2012 Oct;2(10):1243-56. doi: 10.1534/g3.112.004002. Epub 2012 Oct 1. G3 (Bethesda). 2012. PMID: 23050235 Free PMC article. - Mechanisms of activation of interferon regulator factor 3: the role of C-terminal domain phosphorylation in IRF-3 dimerization and DNA binding.
Dragan AI, Hargreaves VV, Makeyeva EN, Privalov PL. Dragan AI, et al. Nucleic Acids Res. 2007;35(11):3525-34. doi: 10.1093/nar/gkm142. Epub 2007 May 5. Nucleic Acids Res. 2007. PMID: 17483521 Free PMC article. - Enhanceosome transcription factors preferentially dimerize with high mobility group proteins.
Jankowski A, Obara P, Mathur U, Tiuryn J. Jankowski A, et al. BMC Syst Biol. 2016 Feb 4;10:14. doi: 10.1186/s12918-016-0258-3. BMC Syst Biol. 2016. PMID: 26847699 Free PMC article. - Interferon Regulatory Factor 9 Structure and Regulation.
Paul A, Tang TH, Ng SK. Paul A, et al. Front Immunol. 2018 Aug 10;9:1831. doi: 10.3389/fimmu.2018.01831. eCollection 2018. Front Immunol. 2018. PMID: 30147694 Free PMC article. Review.
References
- Berkowitz B, Huang DB, Chen-Park FE, Sigler PB, Ghosh G (2002) The x-ray crystal structure of the NF-kappa B p50.p65 heterodimer bound to the interferon beta -kappa B site. J Biol Chem 277: 24694–24700 - PubMed
- Brunger AT, Adams PD, Clore GM, DeLano WL, Gros P, Grosse-Kunstleve RW, Jiang JS, Kuszewski J, Nilges M, Pannu NS, Read RJ, Rice LM, Simonson T, Warren GL (1998) Crystallography & NMR system: a new software suite for macromolecular structure determination. Acta Crystallogr D 54: 905–921 - PubMed
- Carey M (1998) The enhanceosome and transcriptional synergy. Cell 92: 5–8 - PubMed
- Chen L, Glover JN, Hogan PG, Rao A, Harrison SC (1998) Structure of the DNA-binding domains from NFAT, Fos and Jun bound specifically to DNA. Nature 392: 42–48 - PubMed
- Chinenov Y, Kerppola TK (2001) Close encounters of many kinds: Fos–Jun interactions that mediate transcription regulatory specificity. Oncogene 20: 2438–2452 - PubMed
Publication types
MeSH terms
Substances
LinkOut - more resources
Full Text Sources
Other Literature Sources
Molecular Biology Databases
Miscellaneous
