Superparamagnetic iron oxide-labeled Schwann cells and olfactory ensheathing cells can be traced in vivo by magnetic resonance imaging and retain functional properties after transplantation into the CNS - PubMed (original) (raw)
Superparamagnetic iron oxide-labeled Schwann cells and olfactory ensheathing cells can be traced in vivo by magnetic resonance imaging and retain functional properties after transplantation into the CNS
Mark D Dunning et al. J Neurosci. 2004.
Abstract
Schwann cell (SC) and olfactory ensheathing cell (OEC) transplantation has been shown experimentally to promote CNS axonal regeneration and remyelination. To advance this technique into a clinical setting it is important to be able to follow the fates of transplanted cells by noninvasive imaging. Previous studies, using complex modification processes to enable uptake of contrast agents, have shown that cells labeled in vitro with paramagnetic contrast agents transplanted into rodent CNS can be visualized using magnetic resonance imaging (MRI). Here we show that SCs and OECs efficiently internalize dextran-coated superparamagnetic iron oxide (SPIO) from the culture medium by fluid phase pinocytosis. After transplantation into focal areas of demyelination in adult rat spinal cord both transplanted SPIO-labeled SCs and OECs produce a signal reduction using T(2)-weighted MRI in anesthetized rats that persists for up to 4 weeks. Although signal reduction was discernable after transplantation of unlabelled cells, this is nevertheless distinguishable from that produced by transplanted labeled cells. The region of signal reduction in SPIO-labeled cell recipients correlates closely with areas of remyelination. Because the retention of functional integrity by labeled cells is paramount, we also show that SPIO-labeled SCs and OECs are able to myelinate normally after transplantation into focal areas of demyelination. These studies demonstrate the feasibility of noninvasive imaging of transplanted SCs and OECs and represent a significant step toward the clinical application of promising experimental approaches.
Figures
Figure 1.
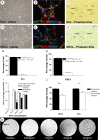
In vitro appearance of SCs and OECs labeled with SPIO. A, Phase micrograph showing SCs in vitro after purification and amplification for 4 weeks. B, sample of the SCs shown in A, immunolabeled for p75NTR (green) and GFAP (red) and nuclei stained with DAPI (blue). C, PB-stained Schwann cells after incubation for 48 hr with SPIO (2 mg/ml equivalent of Fe). Blue intracellular inclusions containing SPIO can be identified (arrows). D, Phase micrograph of OECs in vitro after purification using immunopanning for p75NTR and subsequent amplification for 4 weeks. E, OECs immunolabeled in vitro for p75NTR (green) and GFAP (red) nuclei stained with DAPI (blue). F, PB-stained SCs after incubation for 48 hr with SPIO (2 mg/ml equivalent of Fe); arrows indicate blue intracellular inclusions. G, Graph showing the proportion of p75NTR-positive SCs in cultures from B, stained for p75NTR, GFAP, and Thy1.1. H, Graph showing the proportion of p75-positive OECs in cultures from E, when stained for p75NTR, GFAP, and fibronectin. I, Graph showing the effect of increasing the concentration of SPIO (0-4 mg/ml Fe equivalent) on the labeling intensity of cultured SCs. The proportions of abundantly labeled cells increases relative to those detectably labeled with increasing concentrations of SPIO. At >2 mg/ml this increase is no longer significant. J, Graph showing the comparative labeling intensities between SCs and OECs after 48 hr incubation with SPIO at a concentration equivalent to 2 mg/ml Fe. There is no significant difference between the degree of detectably or abundantly labeled cells between SCs and OECs. There is a significant difference between those cells detectably and abundantly labeled within each cell type (p < 0.05 for SCs and p < 0.001 for OECs). K, T2-weighted MR images through a series of gelatin phantoms (4% w/v) containing SPIO-labeled SCs at increasing concentrations of SPIO (0.5-4 mg/ml, cell concentration 5 × 10⁴/ml). The labeled cells embedded within gelatin are increasingly apparent as black (hypointense) pixels as the concentration of SPIO is increased. Note the presence of a hypointense air bubble within the control gelatin phantom (arrow).
Figure 2.
Electron microscopic in vitro appearance of SCs labeled with SPIO. A, SCs labeled with SPIO equivalent to 2 mg/ml Fe for 48 hr. Multiple electron-dense intracytoplasmic SPIO inclusions are present within each cell (arrows). B, Higher-power image showing a small number of the SPIO inclusions present in A. Inset shows the margin of the inclusion marked with an asterisk, demonstrating the SPIO inclusion enclosed within a membrane (arrows) and residing in an endocytic compartment. Scale bar: A, 1 μm; B, 0.1 μm.
Figure 3.
Effects of inhibitors of phagocytosis and pinocytosis on the uptake of SPIO in vitro. SC cultures were preincubated for 2 hr with colchicine or cytochalasin B before incubation with SPIO for a further 24 hr. A, Graph demonstrating the proportion of cells detectably labeled for each culture condition. There is no significant difference between any of the groups. B, Graph demonstrating the proportion of cells abundantly labeled for each culture condition; there is a significant reduction in the degree of labeling in the SC cultures incubated with 50 and 500 mg/ml of colchicine, when compared with the other culture conditions (*p < 0.001). There was no significant effect of cytochalasin B at any of the concentrations used.
Figure 4.
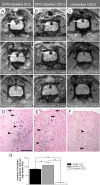
In vivo MR images 5 d after transplantation of SPIO-labeled SCs (A) and OECs (B) and unlabelled glial cells (C) into focal areas of demyelination in the dorsal funiculus of the spinal cord. Images are from 1-mm-thick slices and progress in a caudal direction beginning at the transplant site (0 mm). A and B show a large reduction in signal intensity (black) in the region of the transplant site because of presence of SPIO-labeled SCs and OECs, demonstrating the bloom effect, in which the distortion of the magnetic field is over a greater area than the likely distribution of SPIO (arrows). The images from a recipient of unlabelled OECs (C) shows a smaller reduction in signal intensity with no bloom effect (arrow) when compared with A and B. Hematoxylin and eosin sections costained with PB, 5 d after transplantation of SPIO-labeled SCs (D), SPIO-labeled OECs (E), and unlabelled OECs (F), into X-EB lesions in the dorsal funiculus. PB-positive cells are visible in D-F (arrowheads), although in control animals (F) the numbers are substantially lower. PB-positive cells are present along the injection tract in recipients of SPIO-labeled cells only (D, E, black arrows). G, There is a significant difference in the mean numbers of PB-positive cells per high-power field from animals receiving SPIO-labeled cells compared with controls (**p < 0.001). There is also a significant difference in PB-positive cells, between the SPIO labeled SCs and SPIO labeled OECs at the transplant site (*p < 0.05). Scale bar: D—F, 150 μm.
Figure 5.
MR images showing the appearance of transplanted cells in vivo and ex vivo within the same animals. All panels show T2-weighted MR images of 1 mm slice thickness progressing in a rostral (negative) to caudal (positive) direction, where 0 represents the transplant site. MR images from a recipient of SPIO-labeled OECs (A-C) and unlabelled OECs (D-F) transplanted into an X-EB lesion in the dorsal funiculus are shown. A, Serial 1 mm images beginning 2-3 mm rostral to the transplant site 5 d after transplantation. The hypointense region (black) in the dorsal funiculus (arrow) can be seen for up to 5 mm around the transplant site. B shows subsequent images 4 weeks after transplantation, of the region of spinal cord shown in A. The hypointense area is still present within the dorsal funiculus and now extends for >5 mm. C shows the ex vivo appearance of the spinal cord shown in B, after fixation. D, At 5 d a smaller hypointense region is present in association with transplantation of unlabelled OECs (arrow). E, Images of the region of spinal cord shown in D at 4 weeks after transplantation. A hypointense area remains present but without further rostrocaudal spread. F, The ex vivo appearance of the spinal cord shown in E, after fixation. The ex vivo images are sharper, because of lower signal-to-noise ratios. However, there is a close correlation between the region of hypointensity in the dorsal funiculus obtained in vivo and that seen within the fixed cord (compare B, C, and E, F).
Figure 6.
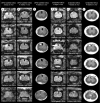
Ex vivo T2-weighted MR images 4 weeks after transplantation of SPIO-labeled SCs and OECs and unlabelled SCs compared with spontaneously remyelinating EB lesions and nonremyelinating X-EB lesions. Images are of 1-mm-thick slices, where 0 represents the transplant site with rostral (negative) and caudal images (positive) indicated. The presence of SPIO within labeled cells SCs (A) and OECs (B) shortens the T2 of the surrounding water protons and producing a signal void at the transplant site (arrow). A bloom effect can be seen in 1 mm serial slices for at least 4 mm. The cord receiving unlabeled SCs (C), has a smaller hypointense region than that present in A and B (arrow). The series of images shown here represent the maximal detected signal reduction caused by transplantation of unlabelled cells; in many animals there was no apparent signal reduction. D, T2-weighted MR images 4 weeks after creation of an EB lesion in the dorsal funiculus. The lesion site is hyperintense relative to the normal dorsal funiculus rostral and caudal to the lesion. The persisting hyperintensity (arrow) in these spontaneously remyelinating lesions indicates that remyelination per se is not responsible for the hypointensity seen in the cell transplant recipients. E, T2-weighted MR images 4 weeks after creation of an X-EB lesion in the dorsal funiculus. The persistently demyelinated region can be seen (arrow) is hyperintense relative to the normal dorsal funiculus. It is not possible to distinguish between this persistently demyelinated and the remyelinated dorsal funiculus shown in D.
Figure 7.
Remyelination by transplanted SPIO-labeled SCs and SPIO-labeled OECs. A, Light micrograph of a toluidine blue-stained resin section from the transplant site in the dorsal funiculus 4 weeks after transplantation of SPIO-labeled SCs. Peripheral type myelination with characteristic signet ring appearance (arrow) can be seen around most of the axons (there is no remyelination in the absence of cell transplantation in the X-EB lesion). B, Electron micrograph of transplanted SCs from the area shown in A. The top cell has produced a myelin sheath and contains electron-dense cytoplasmic SPIO inclusions (arrow). The bottom cell is extending processes around a demyelinated axon and contains SPIO inclusions (black arrow). C, Light micrograph of a toluidine blue-stained resin section from the transplant site in the dorsal funiculus, 4 weeks after transplantation of SPIO-labeled OECs. As with SC transplantation, peripheral type myelination with characteristic signet ring appearance (black arrow) can be seen around many of the axons. D, Electron micrograph showing two SPIO inclusions (black arrows) within a myelinating OEC. Inset, A transplanted OEC containing a SPIO inclusion extending processes around a demyelinated axon. Scale bar: A, C, 50 μm; B, 0.75 μm; D, 0.25 μm; D, inset, 0.3 μm.
Figure 8.
Comparison of ex vivo MR images with the light micrographs from the respective spinal cord sections 4 weeks after transplantation of SPIO-labeled SCs and OECs and unlabelled SCs into X-EB lesions; a nontransplanted EB lesion after 4 weeks is also shown. A, D, MR images from a recipient of transplanted SPIO-labeled SCs and OECs, respectively; B and E show the corresponding light micrographs. The arrows delineate the perimeter of the remyelinated areas in the dorsal funiculus and demonstrate a good correlation with the outline of the hypointense regions on the MR images. C, F, High-power views from the boxed areas in B and E, highlighting axons remyelinated by transplanted SCs (rSC) or OECs (rOEC). Regions containing demyelinated axons (D) and normally myelinated axons (N) lie outside the hypointense regions on the MR images. G, MR image from a recipient of transplanted unlabelled SCs. The region of hypointensity in the dorsolateral part of the dorsal funiculus is less extensive than that seen in A and D. H, The corresponding light micrograph from the MR image shown in G. The cluster of macrophages on the top left of the lesion site (arrowheads) correlates with the region of hypointensity seen on MR image. The region of remyelinated dorsal funiculus (*) does not correspond with the hypointensity on the corresponding MR image, but instead relates to an area of hyperintensity adjacent to the hypointense region (white arrow). I, A high-power view of the boxed area in H; debris-filled macrophages (M) and demyelinated axons (D) are present. J, MR image showing the hyperintense appearance of the epicenter of a spontaneously remyelinating EB lesion. K, The corresponding light micrograph from MR image shown in J. The endogenous remyelination is mediated by both oligodendrocytes and SCs. L, A high-power view from the lesion in K indicated by the box, demonstrating axons remyelinated by SCs (rSC) or oligodendrocytes (rOligo). Scale bar: C, F, I, L, 12 μm; B, E, H, 50 μm; K, 100 μm.
Similar articles
- [Comparison of myelin-forming cells as candidates for therapeutic transplantation in demyelinated CNS axons].
Imaizumi T, Lankford KL, Kocsis JD, Sasaki M, Akiyama Y, Hashi K. Imaizumi T, et al. No To Shinkei. 2000 Jul;52(7):609-15. No To Shinkei. 2000. PMID: 10934721 Japanese. - Differing Schwann cells and olfactory ensheathing cells behaviors, from interacting with astrocyte, produce similar improvements in contused rat spinal cord's motor function.
Li BC, Xu C, Zhang JY, Li Y, Duan ZX. Li BC, et al. J Mol Neurosci. 2012 Sep;48(1):35-44. doi: 10.1007/s12031-012-9740-6. Epub 2012 Mar 11. J Mol Neurosci. 2012. PMID: 22407596 - Species-specific control of cellular proliferation and the impact of large animal models for the use of olfactory ensheathing cells and Schwann cells in spinal cord repair.
Wewetzer K, Radtke C, Kocsis J, Baumgärtner W. Wewetzer K, et al. Exp Neurol. 2011 May;229(1):80-7. doi: 10.1016/j.expneurol.2010.08.029. Epub 2010 Sep 15. Exp Neurol. 2011. PMID: 20816827 Review. - Remyelination after olfactory ensheathing cell transplantation into diverse demyelinating environments.
Sasaki M, Lankford KL, Radtke C, Honmou O, Kocsis JD. Sasaki M, et al. Exp Neurol. 2011 May;229(1):88-98. doi: 10.1016/j.expneurol.2011.01.010. Epub 2011 Jan 28. Exp Neurol. 2011. PMID: 21281634 Review.
Cited by
- SPARC from olfactory ensheathing cells stimulates Schwann cells to promote neurite outgrowth and enhances spinal cord repair.
Au E, Richter MW, Vincent AJ, Tetzlaff W, Aebersold R, Sage EH, Roskams AJ. Au E, et al. J Neurosci. 2007 Jul 4;27(27):7208-21. doi: 10.1523/JNEUROSCI.0509-07.2007. J Neurosci. 2007. PMID: 17611274 Free PMC article. - Voltage-dependent K+ currents contribute to heterogeneity of olfactory ensheathing cells.
Rela L, Piantanida AP, Bordey A, Greer CA. Rela L, et al. Glia. 2015 Sep;63(9):1646-59. doi: 10.1002/glia.22834. Epub 2015 Apr 9. Glia. 2015. PMID: 25856239 Free PMC article. - Magnetic nanoparticles for theragnostics.
Shubayev VI, Pisanic TR 2nd, Jin S. Shubayev VI, et al. Adv Drug Deliv Rev. 2009 Jun 21;61(6):467-77. doi: 10.1016/j.addr.2009.03.007. Epub 2009 Apr 20. Adv Drug Deliv Rev. 2009. PMID: 19389434 Free PMC article. Review. - Cell delivery of therapeutic nanoparticles.
McMillan J, Batrakova E, Gendelman HE. McMillan J, et al. Prog Mol Biol Transl Sci. 2011;104:563-601. doi: 10.1016/B978-0-12-416020-0.00014-0. Prog Mol Biol Transl Sci. 2011. PMID: 22093229 Free PMC article. - Magnetic resonance imaging tracking and assessing repair function of the bone marrow mesenchymal stem cells transplantation in a rat model of spinal cord injury.
Zhang H, Wang L, Wen S, Xiang Q, Xiang X, Xu C, Wan Y, Wang J, Li B, Wan Y, Yang Z, Deng DYB. Zhang H, et al. Oncotarget. 2017 Aug 1;8(35):58985-58999. doi: 10.18632/oncotarget.19775. eCollection 2017 Aug 29. Oncotarget. 2017. PMID: 28938612 Free PMC article.
References
- Avellana-Adalid V, Bachelin C, Lachapelle F, Escriou C, Ratzkin B, Baron-Van Evercooren A (1998) In vitro and in vivo behaviour of NDF-expanded monkey Schwann cells. Eur J Neurosci 10: 291-300. - PubMed
- Band H, Bhattacharya A, Talwar GP (1986) Mechanism of phagocytosis by Schwann cells. J Neurol Sci 75: 113-119. - PubMed
- Barnett SC, Alexander CL, Iwashita Y, Gilson JM, Crowther J, Clark L, Dunn LT, Papanastassiou V, Kennedy PG, Franklin RJ (2000) Identification of a human olfactory ensheathing cell that can effect transplant-mediated remyelination of demyelinated CNS axons. Brain 123: 1581-1588. - PubMed
- Baron-Van Evercooren A, Avellana-Adalid V, Lachapelle F, Liblau R (1997) Schwann cell transplantation and myelin repair of the CNS. Mult Scler 3: 157-161. - PubMed
- Blakemore WF (1977) Remyelination of CNS axons by Schwann cells transplanted from the sciatic nerve. Nature 266: 68-69. - PubMed
Publication types
MeSH terms
Substances
LinkOut - more resources
Full Text Sources
Other Literature Sources
Medical


