Long-range compaction and flexibility of interphase chromatin in budding yeast analyzed by high-resolution imaging techniques - PubMed (original) (raw)
Long-range compaction and flexibility of interphase chromatin in budding yeast analyzed by high-resolution imaging techniques
Kerstin Bystricky et al. Proc Natl Acad Sci U S A. 2004.
Abstract
Little is known about how chromatin folds in its native state. Using optimized in situ hybridization and live imaging techniques have determined compaction ratios and fiber flexibility for interphase chromatin in budding yeast. Unlike previous studies, ours examines nonrepetitive chromatin at intervals short enough to be meaningful for yeast chromosomes and functional domains in higher eukaryotes. We reconcile high-resolution fluorescence in situ hybridization data from intervals of 14-100 kb along single chromatids with measurements of whole chromosome arms (122-623 kb in length), monitored in intact cells through the targeted binding of bacterial repressors fused to GFP derivatives. The results are interpreted with a flexible polymer model and suggest that interphase chromatin exists in a compact higher-order conformation with a persistence length of 170-220 nm and a mass density of approximately 110-150 bp/nm. These values are equivalent to 7-10 nucleosomes per 11-nm turn within a 30-nm-like fiber structure. Comparison of long and short chromatid arm measurements demonstrates that chromatin fiber extension is also influenced by nuclear geometry. The observation of this surprisingly compact chromatin structure for transcriptionally competent chromatin in living yeast cells suggests that the passage of RNA polymerase II requires a very transient unfolding of higher-order chromatin structure.
Figures
Fig. 1.
Compaction ratios determined by high-resolution two-color FISH. (A) Schematic representation of the location and spacing of the Chr6 and Chr14 FISH probes. (B_–_E) Combined IF/FISH on diploid _cdc4_-3 cells synchronized in late G1. Representative Zeiss LSM410 confocal images of nuclear midsections show nuclear pores (mAb414; blue) and the two specified FISH probes (red/green; see Insets). Distances between the centers of gravity of the two probes were scored on similar single confocal planes. A cubic spline fit of the frequencies (black line) defines the peak distance as the plot maximum. Results for haploid (gray curve) and diploid (black curve) cells are compared in E. (Bars, 1 μm.) (F) Worm-like chain fit (Eq. 1; black line) of the peak distances versus genomic separation.
Fig. 3.
Quantitative fluorescence analysis of Chr arm length. (A) Four-color epifluorescence and IF (full 3D rendering,
imaris
) of a G1-arrested haploid GA-2201 cell probed with anti-Nop1-CY5 (blue), anti-p90 (SPB)-CY3 (white), Tel5R::CFP (red), and Tel5L::YFP (green). (B) Schematic representation of tet or lac operator insertion sites near the telomeres (distances indicated in kb from left telomere; black sphere, centromere). (C_–_E) As in A except that the Nop1 signal is not shown. The Tetr–YFP background indicated the nucleoplasm in these maximal projections of 10 0.25-μm z sections of GA-2195 (SPB, red; 3L::GFP, green; 3R::GFP, green) (C), GA-2201 (SPB, white; 5L::YFP, green; 5R::CFP, red) (D), and GA-2199 (SPB, white; 6L::YFP, green; 6R::CFP, red) (E). Frequencies of 3D telomere-SPB distances are plotted by 0.2-μm categories (median value ± 0.1). The summary of the average distances is given in Table 2. (Bars, 1 μm.)
Fig. 2.
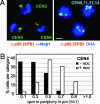
Centromere clustering around the SPB is microtubule-dependent. (A) Combined IF/FISH images of G1-arrested cells probed with anti-p90 (SPB)-CY3 (red), anti-Nop1 (nucleolus)-CY5 (blue), and CEN3, CEN5, or CEN6 (green, as indicated). Full 3D rendering was performed with
imaris
(Bitplane, Zurich). Combined IF/FISH of diploid cells synchronized in G1 with combined probes to CEN8, CEN11, CEN13, and CEN14 (light blue), DNA stain (TOTO-3; blue), and anti-p90 (red). (Bar, 1 μm.) (B) Localization of GFP-tagged CEN4 relative to the nuclear periphery in G1-phase cells exposed to 1% DMSO with (filled bars) or without (open bars) 10 μg/ml nocodazole (noc). Time-lapse movies were acquired as in ref. . Relative 2D spot-periphery distances were averaged over six to nine movies (1,200–1,800 frames) and plotted in intervals of 0.2 μm (median value ± 0.1).
Fig. 4.
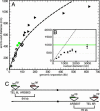
Compaction ratio of yeast interphase chromatin. (A) SPB-telomere distances corrected for the SPB-centromere distance of 300 nm (▴) are plotted on the polymer fit from Eq. 1 by using the peak FISH values (○). The equivalent plot with adjusted rms values for the FISH data is in Fig. 5. (B) Simulated rms end-to-end distances of a 3-μm chromatin chain with a Lp of 190 nm and a diameter of 30 nm confined into a spherical nucleus of varying diameter. The green line indicates the theoretical rms end-to-end distance of 1.03 μm for the same chain without confinement. The dashed line indicates the maximum possible extension of the chain (end-to-end distance is equivalent to nuclear diameter). (C) Schematic representation of tet or lac operator insertion sites for in vivo distance measures that are plotted in green in A.
Similar articles
- The genome folding mechanism in yeast.
Kimura H, Shimooka Y, Nishikawa J, Miura O, Sugiyama S, Yamada S, Ohyama T. Kimura H, et al. J Biochem. 2013 Aug;154(2):137-47. doi: 10.1093/jb/mvt033. Epub 2013 Apr 24. J Biochem. 2013. PMID: 23620598 - FISH as a tool to investigate chromosome behavior in budding yeast.
Scherthan H, Loidl J. Scherthan H, et al. Methods Mol Biol. 2010;659:363-77. doi: 10.1007/978-1-60761-789-1_28. Methods Mol Biol. 2010. PMID: 20809327 - Chromatin structure of the yeast URA3 gene at high resolution provides insight into structure and positioning of nucleosomes in the chromosomal context.
Tanaka S, Livingstone-Zatchej M, Thoma F. Tanaka S, et al. J Mol Biol. 1996 Apr 19;257(5):919-34. doi: 10.1006/jmbi.1996.0212. J Mol Biol. 1996. PMID: 8632475 - Principles of chromosomal organization: lessons from yeast.
Zimmer C, Fabre E. Zimmer C, et al. J Cell Biol. 2011 Mar 7;192(5):723-33. doi: 10.1083/jcb.201010058. J Cell Biol. 2011. PMID: 21383075 Free PMC article. Review. - Electron microscopy and atomic force microscopy studies of chromatin and metaphase chromosome structure.
Daban JR. Daban JR. Micron. 2011 Dec;42(8):733-50. doi: 10.1016/j.micron.2011.05.002. Epub 2011 May 12. Micron. 2011. PMID: 21703860 Review.
Cited by
- Chromatin fiber dynamics under tension and torsion.
Lavelle C, Victor JM, Zlatanova J. Lavelle C, et al. Int J Mol Sci. 2010 Apr 12;11(4):1557-79. doi: 10.3390/ijms11041557. Int J Mol Sci. 2010. PMID: 20480035 Free PMC article. Review. - A single dose of cocaine rewires the 3D genome structure of midbrain dopamine neurons.
Szabó D, Franke V, Bianco S, Batiuk MY, Paul EJ, Kukalev A, Pfisterer UG, Irastorza-Azcarate I, Chiariello AM, Demharter S, Zea-Redondo L, Lopez-Atalaya JP, Nicodemi M, Akalin A, Khodosevich K, Ungless MA, Winick-Ng W, Pombo A. Szabó D, et al. bioRxiv [Preprint]. 2024 May 12:2024.05.10.593308. doi: 10.1101/2024.05.10.593308. bioRxiv. 2024. PMID: 38766140 Free PMC article. Preprint. - Spatial organization of chromatin domains and compartments in single chromosomes.
Wang S, Su JH, Beliveau BJ, Bintu B, Moffitt JR, Wu CT, Zhuang X. Wang S, et al. Science. 2016 Aug 5;353(6299):598-602. doi: 10.1126/science.aaf8084. Epub 2016 Jul 21. Science. 2016. PMID: 27445307 Free PMC article. - Differential chromosome conformations as hallmarks of cellular identity revealed by mathematical polymer modeling.
Lassadi I, Kamgoué A, Goiffon I, Tanguy-le-Gac N, Bystricky K. Lassadi I, et al. PLoS Comput Biol. 2015 Jun 1;11(6):e1004306. doi: 10.1371/journal.pcbi.1004306. eCollection 2015 Jun. PLoS Comput Biol. 2015. PMID: 26030148 Free PMC article. - Colocalization of coregulated genes: a steered molecular dynamics study of human chromosome 19.
Di Stefano M, Rosa A, Belcastro V, di Bernardo D, Micheletti C. Di Stefano M, et al. PLoS Comput Biol. 2013;9(3):e1003019. doi: 10.1371/journal.pcbi.1003019. Epub 2013 Mar 28. PLoS Comput Biol. 2013. PMID: 23555238 Free PMC article.
References
- Woodcock, C. L. & Dimitrov, S. (2001) Curr. Opin. Genet. Dev. 11, 130–135. - PubMed
- Hansen, J. C. (2002) Annu. Rev. Biophys. Biomol. Struct. 31, 361–392. - PubMed
- Gasser, S. M. (2002) Science 296, 1412–1416. - PubMed
- Marshall, W. F. (2002) Curr. Biol. 12, R185–R192. - PubMed
- van den Engh, G., Sachs, R. & Trask, B. J. (1992) Science 257, 1410–1412. - PubMed
Publication types
MeSH terms
Substances
LinkOut - more resources
Full Text Sources
Other Literature Sources
Molecular Biology Databases


