High-resolution genomic and expression profiling reveals 105 putative amplification target genes in pancreatic cancer - PubMed (original) (raw)
High-resolution genomic and expression profiling reveals 105 putative amplification target genes in pancreatic cancer
Eija H Mahlamäki et al. Neoplasia. 2004 Sep-Oct.
Abstract
Comparative genomic hybridization (CGH) studies have provided a wealth of information on common copy number aberrations in pancreatic cancer, but the genes affected by these aberrations are largely unknown. To identify putative amplification target genes in pancreatic cancer, we performed a parallel copy number and expression survey in 13 pancreatic cancer cell lines using a 12,232-clone cDNA microarray, providing an average resolution of 300 kb throughout the human genome. CGH on cDNA microarray allowed highly accurate mapping of copy number increases and resulted in identification of 24 independent amplicons, ranging in size from 130 kb to 11 Mb. Statistical evaluation of gene copy number and expression data across all 13 cell lines revealed a set of 105 genes whose elevated expression levels were directly attributable to increased copy number. These included genes previously reported to be amplified in cancer as well as several novel targets for copy number alterations, such as p21-activated kinase 4 (PAK4), which was previously shown to be involved in cell migration, cell adhesion, and anchorage-independent growth. In conclusion, our results implicate a set of 105 genes that is likely to be actively involved in the development and progression of pancreatic cancer.
Figures
Figure 1
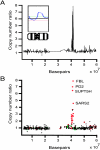
Gene copy number and expression analysis for chromosome 19 in the Panc1 pancreatic cancer cell line by cDNA microarray. The copy number ratios were plotted as a function of the position of the cDNA clones along chromosome 19. In (A), individual data points were connected with a line. The inset shows chromosomal CGH copy number ratio profile. In (B), individual data points were color-coded according to cDNA expression ratios. The red dots indicate overexpressed genes (the upper 7% of expression ratios) and the green dots indicate underexpressed genes (lowest 7% of expression ratios) in Panc1 cells.
Similar articles
- Copy number alterations in pancreatic cancer identify recurrent PAK4 amplification.
Chen S, Auletta T, Dovirak O, Hutter C, Kuntz K, El-ftesi S, Kendall J, Han H, Von Hoff DD, Ashfaq R, Maitra A, Iacobuzio-Donahue CA, Hruban RH, Lucito R. Chen S, et al. Cancer Biol Ther. 2008 Nov;7(11):1793-802. doi: 10.4161/cbt.7.11.6840. Epub 2008 Nov 21. Cancer Biol Ther. 2008. PMID: 18836286 Free PMC article. - Integrated analysis of expression and genome alteration reveals putative amplified target genes in esophageal cancer.
Sugimoto T, Arai M, Shimada H, Hata A, Seki N. Sugimoto T, et al. Oncol Rep. 2007 Aug;18(2):465-72. Oncol Rep. 2007. PMID: 17611672 - Identification of novel candidate target genes in amplicons of Glioblastoma multiforme tumors detected by expression and CGH microarray profiling.
Ruano Y, Mollejo M, Ribalta T, Fiaño C, Camacho FI, Gómez E, de Lope AR, Hernández-Moneo JL, Martínez P, Meléndez B. Ruano Y, et al. Mol Cancer. 2006 Sep 26;5:39. doi: 10.1186/1476-4598-5-39. Mol Cancer. 2006. PMID: 17002787 Free PMC article. - Genome-wide analysis of pancreatic cancer using microarray-based techniques.
Harada T, Chelala C, Crnogorac-Jurcevic T, Lemoine NR. Harada T, et al. Pancreatology. 2009;9(1-2):13-24. doi: 10.1159/000178871. Epub 2008 Dec 12. Pancreatology. 2009. PMID: 19077451 Review. - Novel technology for detection of genomic and transcriptional alterations in pancreatic cancer.
Wallrapp C, Müller-Pillasch F, Micha A, Wenger C, Geng M, Solinas-Toldo S, Lichter P, Frohme M, Hoheisel JD, Adler G, Gress TM. Wallrapp C, et al. Ann Oncol. 1999;10 Suppl 4:64-8. Ann Oncol. 1999. PMID: 10436788 Review.
Cited by
- P21-activated kinase 5 plays essential roles in the proliferation and tumorigenicity of human hepatocellular carcinoma.
Fang ZP, Jiang BG, Gu XF, Zhao B, Ge RL, Zhang FB. Fang ZP, et al. Acta Pharmacol Sin. 2014 Jan;35(1):82-8. doi: 10.1038/aps.2013.31. Epub 2013 May 20. Acta Pharmacol Sin. 2014. PMID: 23685956 Free PMC article. - Expansion of BCR/ABL1+ cells requires PAK2 but not PAK1.
Edlinger L, Berger-Becvar A, Menzl I, Hoermann G, Greiner G, Grundschober E, Bago-Horvath Z, Al-Zoughbi W, Hoefler G, Brostjan C, Gille L, Moriggl R, Spittler A, Sexl V, Hoelbl-Kovacic A. Edlinger L, et al. Br J Haematol. 2017 Oct;179(2):229-241. doi: 10.1111/bjh.14833. Epub 2017 Jul 14. Br J Haematol. 2017. PMID: 28707321 Free PMC article. - Bioinformatics and cancer: an essential alliance.
Dopazo J. Dopazo J. Clin Transl Oncol. 2006 Jun;8(6):409-15. doi: 10.1007/s12094-006-0194-6. Clin Transl Oncol. 2006. PMID: 16790393 Review. - Small-molecule p21-activated kinase inhibitor PF-3758309 is a potent inhibitor of oncogenic signaling and tumor growth.
Murray BW, Guo C, Piraino J, Westwick JK, Zhang C, Lamerdin J, Dagostino E, Knighton D, Loi CM, Zager M, Kraynov E, Popoff I, Christensen JG, Martinez R, Kephart SE, Marakovits J, Karlicek S, Bergqvist S, Smeal T. Murray BW, et al. Proc Natl Acad Sci U S A. 2010 May 18;107(20):9446-51. doi: 10.1073/pnas.0911863107. Epub 2010 May 3. Proc Natl Acad Sci U S A. 2010. PMID: 20439741 Free PMC article. - Identification of genetic alterations in pancreatic cancer by the combined use of tissue microdissection and array-based comparative genomic hybridisation.
Harada T, Baril P, Gangeswaran R, Kelly G, Chelala C, Bhakta V, Caulee K, Mahon PC, Lemoine NR. Harada T, et al. Br J Cancer. 2007 Jan 29;96(2):373-82. doi: 10.1038/sj.bjc.6603563. Br J Cancer. 2007. PMID: 17242705 Free PMC article.
References
- Jemal A, Murray T, Samuels A, Ghafoor A, Ward E, Thun MJ. Cancer statistics. CA Cancer J Clin. 2003;53:5–26. - PubMed
- Greenlee RT, Hill-Harmon MB, Murray T, Thun MJ. Cancer statistics. CA Cancer J Clin. 2001;51:15–36. - PubMed
- Schnall SF, Macdonald JS. Chemotherapy of adenocarcinoma of the pancreas. Semin Oncol. 1996;23:220–228. - PubMed
- Lowenfels AB, Maisonneuve P. Pancreatico-biliary malignancy: prevalence and risk factors. Ann Oncol. 1999;10:1–3. - PubMed
- Schuller HM. Mechanisms of smoking-related lung and pancreatic adenocarcinoma development. Nat Rev Cancer. 2002;2:455–463. - PubMed
Publication types
MeSH terms
Substances
LinkOut - more resources
Full Text Sources
Medical
Research Materials
Miscellaneous
