Hec1 and nuf2 are core components of the kinetochore outer plate essential for organizing microtubule attachment sites - PubMed (original) (raw)
Hec1 and nuf2 are core components of the kinetochore outer plate essential for organizing microtubule attachment sites
Jennifer G DeLuca et al. Mol Biol Cell. 2005 Feb.
Abstract
A major goal in the study of vertebrate mitosis is to identify proteins that create the kinetochore-microtubule attachment site. Attachment sites within the kinetochore outer plate generate microtubule dependent forces for chromosome movement and regulate spindle checkpoint protein assembly at the kinetochore. The Ndc80 complex, comprised of Ndc80 (Hec1), Nuf2, Spc24, and Spc25, is essential for metaphase chromosome alignment and anaphase chromosome segregation. It has also been suggested to have roles in kinetochore microtubule formation, production of kinetochore tension, and the spindle checkpoint. Here we show that Nuf2 and Hec1 localize throughout the outer plate, and not the corona, of the vertebrate kinetochore. They are part of a stable "core" region whose assembly dynamics are distinct from other outer domain spindle checkpoint and motor proteins. Furthermore, Nuf2 and Hec1 are required for formation and/or maintenance of the outer plate structure itself. Fluorescence light microscopy, live cell imaging, and electron microscopy provide quantitative data demonstrating that Nuf2 and Hec1 are essential for normal kinetochore microtubule attachment. Our results indicate that Nuf2 and Hec1 are required for organization of stable microtubule plus-end binding sites in the outer plate that are needed for the sustained poleward forces required for biorientation at kinetochores.
Figures
Figure 2.
The effect of Nuf2 depletion on kMT binding. Electron micrographs of HeLa cells 48 h after mock-transfection (A-C) or transfection with hNuf2-siRNA (D-H). Arrows indicate typical examples of the robust (A-C) and deficient (D-H) bundles of microtubules associated with kinetochores of mock- and siRNA-transfected cells. (A) Low magnification view of a single serial section of a mock-transfected control cell. The well-formed metaphase plate persisted through all serial sections of the cell. (B and C) Serial section views of a kinetochore from a control cell. All kinetochores that were followed through serial sections had robust kinetochore fibers. (D) Low-magnification view of a single serial section from a transfected cell. Although some sections gave the appearance of partial metaphase alignment, this was not well maintained through the serial sections and virtually no kinetochore fibers were found. (E and F) Serial section views of a kinetochore from a transfected cell. It was more difficult to find kinetochores in transfected cells than in controls cells (see Table 1), and only a few of the kinetochores examined had more than 6-8 kMTs bound. (G and H) Serial section views from a transfected cell showing lateral interactions between spindle MTs and the centromere region of a chromosome. Scale bars: (A and D) 1 μm; (B, C, E, F, G, and H) 400 nm.
Figure 1.
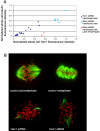
Cold stable microtubules do not persist in cells depleted of Nuf2 and Hec1. Forty-eight hours posttransfection with Hec1 siRNA, HeLa cells were incubated in an icewater bath for 10 min, followed by extraction and fixation on ice. (A) Cells were processed for immunofluorescence and stained with Hec1 and α-tubulin antibodies. Image stacks of mock-transfected and Hec1 siRNA-transfected cells were captured using a spinning disk confocal fluorescence microscope. For quantification, a 20-image _z_-series stack was summed. A circle that included the entire cell was chosen as the constant area for quantification for all conditions. A background circle twice the area of the original circle was used to measure the background fluorescence. The circle sizes (small circle: d = 200 pixels; large circle: d = 283 pixels) were constant for every cell analyzed. The average whole cell integrated fluorescence intensities for Hec1 and tubulin are plotted in X and Y, respectively. Cells from the test coverslip were chosen to include those with a range of Hec1 depletion levels (blue diamonds). Metaphase cells from control coverslips are represented by the squares (light blue). Cells from control coverslips in late prophase are also shown (pink triangles): these cells have high levels of Hec1, but have not yet formed a bipolar spindle and kMT attachments; thus, the levels of stable microtubule polymer is low. (B) Control and Hec1 siRNA-transfected cells were cold-treated, processed for immunofluorescence, and stained with tubulin antibodies (green) and CREST antibodies (red). Maximum projections were produced from image stacks using the “stack arithmetic” function accessed using the Metamorph software analysis system (Universal Imaging) with identical image processing and contrast enhancement.
Figure 3.
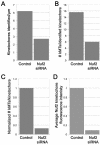
Quantification of microtubule binding to kinetochores in control versus Nuf2-depleted cells. The numbers of kinetochores identified per micrometer of cell sectioned (A), and the number of microtubules per kinetochore (B), were averaged for control (n = 2 cells; 32 kinetochores) and Nuf2 siRNA-transfected cells (5 cells; 28 kinetochores). Kinetochore-microtubule numbers in Nuf2 siRNA-transfected cells were normalized to kinetochore-microtubule numbers in control cells by assigned a value of zero attached microtubules to the “unidentified kinetochores” (C). The average reduction of kinetochore-microtubules detected by EM in C is similar to the average reduction in Nuf2 at kinetochores in siRNA-transfected HeLa cells as measured by immunofluorescence microscopy (D).
Figure 4.
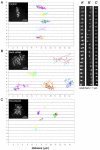
Kinetochores with depleted levels of Nuf2 and Hec1 move erratically and in a microtubule-dependent manner. HeLa cells transiently expressing CENPB-GFP were mock siRNA transfected (A and A′) or transfected with Nuf2 siRNA (B and B′). Forty-eight hours after siRNA transfection, cells were imaged on a spinning disk confocal microscope. Images were collected every 10 s over a period of 10-40 min. For microtubule depolymerization experiments, mock-transfected cells were incubated with 20 μM nocodazole for 2 h before imaging (C and C′). Individual kinetochores and their corresponding sisters were tracked using the “track points” function accessed using the Metamorph software analysis system (Universal Imaging), and points were plotted on X and Y axes (A-C). Insets show a maximum projection of a _z_-series stack through a cell from each corresponding condition (scale bars, 5 μm). Montages in A′-C′ are frames from the time-lapse movies at 10-s intervals showing a single representative sister kinetochore pair from each condition (scale bars, 1 μm).
Figure 5.
The Ndc80 complex defines a distinct region of the kinetochore outer domain. (A and B) PtK1 cells were incubated for 30 min in either control buffer (Saline G) or buffer supplemented with 5 mM sodium azide/deoxyglucose to deplete ATP before fixation for immunofluorescence. Hec1 is largely retained at kinetochores after inhibitor treatment (A), whereas CENP-E fluorescence is diminished at kinetochores and concentrated at spindle poles after inhibitor treatment (B). For quantification, ∼130 kinetochores from 8 different cells were measured for each condition. (C and D) Deconvolved immunofluorescence images from cells treated for 2 h with 20 μM nocodazole before fixation: stained for CENP-E (C) or CREST antigens in red (D), and Hec1 in green. A single kinetochore pair (top) is also shown for each: arrows indicate the planes where line scans were performed (bottom). Line scans were performed using the “Linescan” function accessed using the Metamorph software system (Universal Imaging). Data from linescans were logged into Microsoft Excel to generate graphs.
Figure 6.
Hec1 localizes to the kinetochore outer plate. HeLa cells grown to 60-80% confluency were treated with 20 μM nocodazole for 3 h, extracted, and fixed. Fixed cells were treated with monoclonal anti-Hec1 primary antibody and anti-mouse secondary conjugated to 0.8-nm gold clusters that were then enhanced with silver reagent. (A) Low-magnification overview. Linear concentrations of silver-enhanced gold particles distinguishes kinetochore labeling (arrows) from the sparse occurrence of particles in the background. (B-D) Higher magnification examples of kinetochore labeling. Arrows indicate regions where the outer plate is visible underneath gold particles. (E) Enface or semienface views of labeled kinetochores (arrows). Note the more circular arrangement of gold particles. Scale bars: (A) 1 μm; (B-E) 200 nm.
Figure 7.
The effect of Nuf2 depletion on the formation and/or stability of the kinetochore outer plate. HeLa cells 48 h after mock-transfection (A-C), or transfection with hNuf2-siRNA (D-F, H, and I), were treated with 20 μM nocodazole for 3 h to disassemble all MTs and promote growth of the kinetochore outer domain. Cells were then fixed and prepared for EM. (A) Low-magnification view of a nocodazole-treated, mock-transfected cell. Several well-formed, unbound kinetochores are visible in the section (arrows). (B) A pair of well-formed sister kinetochores from a control cell. Note the robust outer plates (arrows). (C) Example of a poorly formed kinetochore from a control cell. The outer plate (arrow) is less dense and robust compared with the example in B. (D) Low-magnification view of a nocodazole-treated transfected cell. Unbound kinetochores (arrows) were significantly harder to locate compared with control cells. (E) A pair of well-formed sister kinetochores from a transfected cell. As in B, the outer plates (arrows) are robust. (F) Poorly formed kinetochore from a transfected cell. The outer plate is much less distinct (arrow). (G) Bar graph showing the numbers of kinetochores found in three control and six transfected cells. The light and dark shadings indicate the number of well-formed (light) and poorly formed kinetochores (dark) found per micron of depth in each of the cells. (H and I) Examples of fibrous material at the putative centromere region of chromosomes from transfected cells. Scale bars: (A and D) 1 μm; (B, C, E, F, H, and I) 200 nm.
Figure 8.
Hec1 siRNA-transfected cells retain high levels of the kinetochore corona component CENP-E. (A) Immunofluorescence images of a control (mock siRNA-transfected) prometaphase cell (top row), a control (mock-transfected) metaphase cell (middle row), and a Hec1 siRNA-transfected cell (bottom row). For each of the images shown, five sequential frames from a through-focal series were projected onto a single image. (B) CENP-E kinetochore fluorescence was measured in three cell populations: control (mock-transfected) prometaphase cells (n = 67 kinetochores), control (mock-transfected) metaphase cells (n = 27 kinetochores), and Hec1 siRNA-transfected cells (n = 165 kinetochores). Values for the graph were normalized to the average kinetochore fluorescence intensity of CENP-E at control prometaphase kinetochores.
Figure 9.
Model for Hec1 and Nuf2 function at the vertebrate kinetochore. Kinetochore structure and protein localization for (A) untreated and (B) Nuf2- or Hec1-depleted kinetochores. We suggest a role of the Ndc80 complex in preventing stripping of Mad1/Mad2 and dynein/dynactin complexes from kinetochores by microtubule interactions (C) and in signaling release of these protein complexes upon normal kinetochore microtubule formation (D). See text for details.
Similar articles
- The NDC80 complex proteins Nuf2 and Hec1 make distinct contributions to kinetochore-microtubule attachment in mitosis.
Sundin LJ, Guimaraes GJ, Deluca JG. Sundin LJ, et al. Mol Biol Cell. 2011 Mar 15;22(6):759-68. doi: 10.1091/mbc.E10-08-0671. Epub 2011 Jan 26. Mol Biol Cell. 2011. PMID: 21270439 Free PMC article. - Dynamic acetylation of the kinetochore-associated protein HEC1 ensures accurate microtubule-kinetochore attachment.
Zhao G, Cheng Y, Gui P, Cui M, Liu W, Wang W, Wang X, Ali M, Dou Z, Niu L, Liu H, Anderson L, Ruan K, Hong J, Yao X. Zhao G, et al. J Biol Chem. 2019 Jan 11;294(2):576-592. doi: 10.1074/jbc.RA118.003844. Epub 2018 Nov 8. J Biol Chem. 2019. PMID: 30409912 Free PMC article. - Chmp4c is required for stable kinetochore-microtubule attachments.
Petsalaki E, Dandoulaki M, Zachos G. Petsalaki E, et al. Chromosoma. 2018 Dec;127(4):461-473. doi: 10.1007/s00412-018-0675-8. Epub 2018 Jul 2. Chromosoma. 2018. PMID: 29968190 - Merotelic kinetochores in mammalian tissue cells.
Salmon ED, Cimini D, Cameron LA, DeLuca JG. Salmon ED, et al. Philos Trans R Soc Lond B Biol Sci. 2005 Mar 29;360(1455):553-68. doi: 10.1098/rstb.2004.1610. Philos Trans R Soc Lond B Biol Sci. 2005. PMID: 15897180 Free PMC article. Review. - The dynamic kinetochore-microtubule interface.
Maiato H, DeLuca J, Salmon ED, Earnshaw WC. Maiato H, et al. J Cell Sci. 2004 Nov 1;117(Pt 23):5461-77. doi: 10.1242/jcs.01536. J Cell Sci. 2004. PMID: 15509863 Review.
Cited by
- Probing microtubule polymerisation state at single kinetochores during metaphase chromosome motion.
Armond JW, Vladimirou E, Erent M, McAinsh AD, Burroughs NJ. Armond JW, et al. J Cell Sci. 2015 May 15;128(10):1991-2001. doi: 10.1242/jcs.168682. Epub 2015 Apr 23. J Cell Sci. 2015. PMID: 25908867 Free PMC article. - The human Mis12 complex is required for kinetochore assembly and proper chromosome segregation.
Kline SL, Cheeseman IM, Hori T, Fukagawa T, Desai A. Kline SL, et al. J Cell Biol. 2006 Apr 10;173(1):9-17. doi: 10.1083/jcb.200509158. Epub 2006 Apr 3. J Cell Biol. 2006. PMID: 16585270 Free PMC article. - CENP-U cooperates with Hec1 to orchestrate kinetochore-microtubule attachment.
Hua S, Wang Z, Jiang K, Huang Y, Ward T, Zhao L, Dou Z, Yao X. Hua S, et al. J Biol Chem. 2011 Jan 14;286(2):1627-38. doi: 10.1074/jbc.M110.174946. Epub 2010 Nov 5. J Biol Chem. 2011. PMID: 21056971 Free PMC article. - Quantifying Changes in Chromosome Position to Assess Chromokinesin Activity.
Thompson AF, Vandal S, Stumpff J. Thompson AF, et al. Methods Mol Biol. 2022;2415:139-149. doi: 10.1007/978-1-0716-1904-9_10. Methods Mol Biol. 2022. PMID: 34972951 - The mitotic checkpoint kinase NEK2A regulates kinetochore microtubule attachment stability.
Du J, Cai X, Yao J, Ding X, Wu Q, Pei S, Jiang K, Zhang Y, Wang W, Shi Y, Lai Y, Shen J, Teng M, Huang H, Fei Q, Reddy ES, Zhu J, Jin C, Yao X. Du J, et al. Oncogene. 2008 Jul 3;27(29):4107-14. doi: 10.1038/onc.2008.34. Epub 2008 Feb 25. Oncogene. 2008. PMID: 18297113 Free PMC article.
References
- Bharadwaj, R., Qi, W., and Yu, H. T. (2004). Identification of two novel components of the human NDC80 kinetochore complex. J. Biol. Chem. 279, 13076-13085. - PubMed
- Brinkley, B. R., and Cartwright, J., Jr. 1975. Cold-labile and cold-stable microtubules in the mitotic spindle of mammalian cells. Ann. NY Acad. Sci. 253, 428-439. - PubMed
- Cleveland, D. W., Mao, Y., and Sullivan, K. F. (2003). Centromeres and kinetochores: from epigenetics to mitotic checkpoint signaling. Cell 112, 407-421. - PubMed
Publication types
MeSH terms
Substances
Grants and funding
- R01 GM066270/GM/NIGMS NIH HHS/United States
- R37 GM024364/GM/NIGMS NIH HHS/United States
- GM066270/GM/NIGMS NIH HHS/United States
- R01 GM024364/GM/NIGMS NIH HHS/United States
- GM24364/GM/NIGMS NIH HHS/United States
- GM66588/GM/NIGMS NIH HHS/United States
- F32 GM066588/GM/NIGMS NIH HHS/United States
LinkOut - more resources
Full Text Sources
Other Literature Sources
Molecular Biology Databases


