Differentiation-induced replication-timing changes are restricted to AT-rich/long interspersed nuclear element (LINE)-rich isochores - PubMed (original) (raw)
Differentiation-induced replication-timing changes are restricted to AT-rich/long interspersed nuclear element (LINE)-rich isochores
Ichiro Hiratani et al. Proc Natl Acad Sci U S A. 2004.
Abstract
The replication timing of some genes is developmentally regulated, but the significance of replication timing to cellular differentiation has been difficult to substantiate. Studies have largely been restricted to the comparison of a few genes in established cell lines derived from different tissues, and most of these genes do not change replication timing. Hence, it has not been possible to predict how many or what types of genes might be subject to such control. Here, we have evaluated the replication timing of 54 tissue-specific genes in mouse embryonic stem cells before and after differentiation to neural precursors. Strikingly, genes residing within isochores rich in GC and poor in long interspersed nuclear elements (LINEs) did not change their replication timing, whereas half of genes within isochores rich in AT and long interspersed nuclear elements displayed programmed changes in replication timing that accompanied changes in gene expression. Our results provide direct evidence that differentiation-induced autosomal replication-timing changes are a significant part of mammalian development, provide a means to predict genes subject to such regulation, and suggest that replication timing may be more related to the evolution of metazoan genomes than to gene function or expression pattern.
Figures
Fig. 1.
Experimental scheme of replication-timing analysis before and after differentiation. (A and B) Undifferentiated (A) and neural differentiated (B) ESCs were pulse-labeled with BrdUrd and then separated into populations from early or late S phase by flow cytometry. The white dotted lines represent the sorting windows for fractions. (C) Differentiation state as determined by RT-PCR. Oct4 (ESC-specific) is down-regulated after differentiation, whereas neural precursor-specific Sox1 is up-regulated. Samples marked -RT did not contain reverse transcriptase in the reaction. (D) Replication-timing analysis of control genes, α-globin (early-replicating in ESC), β-globin (late-replicating in ESC), and mitochondrial DNA (mito; replicates throughout the entire cell cycle) (28). The average and SEM of early S phase abundance (percentage of the total) were measured as described in Materials and Methods. Undiff., undifferentiated ESC; diff., differentiated ESC; E, early S-phase fraction; L, late S-phase fraction; PI, propidium iodide.
Fig. 2.
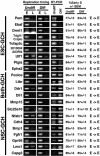
Replication-timing and RT-PCR analyses of GC-rich (GCH) genes. Replication-timing and RT-PCR analyses of genes residing in GC-rich isochores were carried out by using samples prepared from undifferentiated (Undiff.) and differentiated (Diff.) ESCs and categorized by gene expression patterns ESC-specific (ESC-GCH), NSC-specific (NSC-GCH), or expressed in both (Both-GCH). None of the primer sets used gave any PCR product without reverse transcription (data not shown). Similar results were obtained from multiple analyses of two independent experiments in which all genes were analyzed and two additional experiments in which a subset of genes was further analyzed. The mean and the SEM of early S phase abundance (percentage of the total) were measured as described in Materials and Methods. Shown are the gel photographs that were closest to the mean value. E→E indicates early replication before and after differentiation.
Fig. 3.
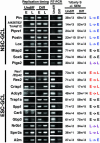
Replication-timing analysis of NSC- and ESC-specific AT-rich (GCL) genes analyzed as for Fig. 2. E, early-replicating; L, late-replicating.
Fig. 4.
Analysis of AT-rich genes that are expressed before and after differentiation (Both-GCL) as for Fig. 2. E, early-replicating; L, late-replicating.
Fig. 5.
Replication-timing changes are restricted to AT/LINE-rich isochores. (A–C) The density of LINE (A) and Lx (a young L1 subfamily) (B) and the average LINE length (C) were plotted against the average GC content of a 400-kb region surrounding the txStart position of 54 genes analyzed in this study as well as genes from the literature analyzed in Table 2. A negative correlation was observed for LINE parameters versus GC content (_R_2 values were 0.61, 0.53, and 0.52 for LINE density, average LINE length, and Lx density, respectively). (A–C) Pink dots represent genes that change replication timing either during differentiation (this study) or in different cell lines (Table 2). (D) A histogram plotting the frequency of genes in different GC content regions. The GC content of a 20-kb window surrounding the txStart of 16,652 RefSeq genes was analyzed. Because no genes at >43.4% GC (20-kb region surrounding the txStart) have been found to change replication timing (Tables 2 and 3), those genes with <43% GC, which represent 34% of all RefSeq genes, are potential candidates for genes subject to replication-timing changes at some point during development (pink bars, <43% GC). Most genes at >43% are probably not subject to replication-timing control and are presumably constitutively early-replicating (blue bars, ≥43% GC).
Similar articles
- Cell type-specific regulation of a replication origin residing within an AT-rich/LINE-1-rich isochore.
Kholodii G, Dantsevich O, Korobov G, Tarantul V. Kholodii G, et al. Cell Cycle. 2009 Dec 15;8(24):4176-8. doi: 10.4161/cc.8.24.10151. Epub 2009 Dec 21. Cell Cycle. 2009. PMID: 19823034 No abstract available. - Global reorganization of replication domains during embryonic stem cell differentiation.
Hiratani I, Ryba T, Itoh M, Yokochi T, Schwaiger M, Chang CW, Lyou Y, Townes TM, Schübeler D, Gilbert DM. Hiratani I, et al. PLoS Biol. 2008 Oct 7;6(10):e245. doi: 10.1371/journal.pbio.0060245. PLoS Biol. 2008. PMID: 18842067 Free PMC article. - Relationships between replication timing and GC content of cancer-related genes on human chromosomes 11q and 21q.
Watanabe Y, Abe T, Ikemura T, Maekawa M. Watanabe Y, et al. Gene. 2009 Mar 15;433(1-2):26-31. doi: 10.1016/j.gene.2008.12.004. Epub 2008 Dec 14. Gene. 2009. PMID: 19124063 - LINEs of evidence: noncanonical DNA replication as an epigenetic determinant.
Belan E. Belan E. Biol Direct. 2013 Sep 13;8:22. doi: 10.1186/1745-6150-8-22. Biol Direct. 2013. PMID: 24034780 Free PMC article. Review. - Replication timing and transcriptional control: beyond cause and effect--part II.
Hiratani I, Takebayashi S, Lu J, Gilbert DM. Hiratani I, et al. Curr Opin Genet Dev. 2009 Apr;19(2):142-9. doi: 10.1016/j.gde.2009.02.002. Epub 2009 Apr 1. Curr Opin Genet Dev. 2009. PMID: 19345088 Free PMC article. Review.
Cited by
- Developmental control of replication timing defines a new breed of chromosomal domains with a novel mechanism of chromatin unfolding.
Takebayashi S, Ryba T, Gilbert DM. Takebayashi S, et al. Nucleus. 2012 Nov-Dec;3(6):500-7. doi: 10.4161/nucl.22318. Epub 2012 Sep 28. Nucleus. 2012. PMID: 23023599 Free PMC article. - Bubble-chip analysis of human origin distributions demonstrates on a genomic scale significant clustering into zones and significant association with transcription.
Mesner LD, Valsakumar V, Karnani N, Dutta A, Hamlin JL, Bekiranov S. Mesner LD, et al. Genome Res. 2011 Mar;21(3):377-89. doi: 10.1101/gr.111328.110. Epub 2010 Dec 20. Genome Res. 2011. PMID: 21173031 Free PMC article. - Computing interaction probabilities in signaling networks.
Gabr H, Rivera-Mulia JC, Gilbert DM, Kahveci T. Gabr H, et al. EURASIP J Bioinform Syst Biol. 2015 Nov 11;2015(1):10. doi: 10.1186/s13637-015-0031-8. eCollection 2015 Dec. EURASIP J Bioinform Syst Biol. 2015. PMID: 26587014 Free PMC article. - Replication-timing boundaries facilitate cell-type and species-specific regulation of a rearranged human chromosome in mouse.
Pope BD, Chandra T, Buckley Q, Hoare M, Ryba T, Wiseman FK, Kuta A, Wilson MD, Odom DT, Gilbert DM. Pope BD, et al. Hum Mol Genet. 2012 Oct 1;21(19):4162-70. doi: 10.1093/hmg/dds232. Epub 2012 Jun 26. Hum Mol Genet. 2012. PMID: 22736031 Free PMC article. - Regulation of DNA replication by chromatin structures: accessibility and recruitment.
Hayashi MT, Masukata H. Hayashi MT, et al. Chromosoma. 2011 Feb;120(1):39-46. doi: 10.1007/s00412-010-0287-4. Epub 2010 Aug 3. Chromosoma. 2011. PMID: 20680317 Review.
References
- Gilbert, D. M. (2002) Curr. Opin. Cell Biol. 14, 377-383. - PubMed
- Goren, A. & Cedar, H. (2003) Nat. Rev. Mol. Cell Biol. 4, 25-32. - PubMed
- Schubeler, D., Scalzo, D., Kooperberg, C., van Steensel, B., Delrow, J. & Groudine, M. (2002) Nat. Genet. 32, 438-442. - PubMed
- Woodfine, K., Fiegler, H., Beare, D. M., Collins, J. E., McCann, O. T., Young, B. D., Debernardi, S., Mott, R., Dunham, I. & Carter, N. P. (2004) Hum. Mol. Genet. 13, 191-202. - PubMed
- Azuara, V., Brown, K. E., Williams, R. R., Webb, N., Dillon, N., Festenstein, R., Buckle, V., Merkenschlager, M. & Fisher, A. G. (2003) Nat. Cell Biol. 5, 668-674. - PubMed
Publication types
MeSH terms
LinkOut - more resources
Full Text Sources
Other Literature Sources
Miscellaneous


