SPOTS: signaling protein oligomeric transduction structures are early mediators of death receptor-induced apoptosis at the plasma membrane - PubMed (original) (raw)
SPOTS: signaling protein oligomeric transduction structures are early mediators of death receptor-induced apoptosis at the plasma membrane
Richard M Siegel et al. J Cell Biol. 2004.
Abstract
Fas (CD95, APO-1, TNFRSF6) is a TNF receptor superfamily member that directly triggers apoptosis and contributes to the maintenance of lymphocyte homeostasis and prevention of autoimmunity. Although FADD and caspase-8 have been identified as key intracellular mediators of Fas signaling, it is not clear how recruitment of these proteins to the Fas death domain leads to activation of caspase-8 in the receptor signaling complex. We have used high-resolution confocal microscopy and live cell imaging to study the sequelae of early events in Fas signaling. These studies have revealed a new stage of Fas signaling in which receptor ligation leads to the formation of surface receptor oligomers that we term signaling protein oligomerization transduction structures (SPOTS). Formation of SPOTS depends on the presence of an intact Fas death domain and FADD but is independent of caspase activity. Analysis of cells expressing Fas mutations from patients with the autoimmune lymphoproliferative syndrome (ALPS) reveals that formation of SPOTS can be disrupted by distinct mechanisms in ALPS.
Figures
Figure 1.
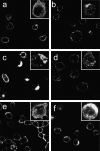
Distinct caspase-dependent and -independent morphological stages in Fas signaling. Immunostaining of Fas performed after the following treatments at 37°C: (A) isotype control; (B) 15-min anti-Fas; (C) 30-min anti-Fas; (D) 60-min anti-Fas with 60-min pretreatment with 50 μM zVAD-fmk; (E) 60-min Anti-FLAG control; (F) 60-min FLAG-FasL and anti-FLAG. For each panel, a low-power mid-cell confocal section and a high power reconstruction of a z-stack of a representative cell is shown. Results are representative of three independent experiments.
Figure 2.
Capping and internalization but not SPOTS depend on caspase activity. (A) SKW 6.4 cells were stimulated as shown and then labeled for surface and internalized Fas as described in the Flow cytometric quantitation of Fas surface levels section of Materials and methods. The top panels show Alexa-488 staining of surface Fas in green, the middle panels show surface and intracellular staining by Alexa-594 in red, and the bottom panels show combined fluorescence with colocalized proteins staining in yellow. Separate experiments showed that the two anti-IgG secondary antisera did not cross-block (not depicted). Each panel shows medium and high power magnifications from left to right. Bars: (left) 5 μm; (right) 1 μm. (B) Flow cytometric quantitation of surface Fas expression after similar treatment of SKW 6.4 cells. Numbers are derived from the geometric mean fluorescence normalized a value of 100 for untreated cells.
Figure 3.
Differential coclustering of SPOTS with lipid rafts in type I and type II cells. Two-color fluorescence microscopy of cells treated with anti-Fas in the presence of Alexa-594–labeled cholera toxin B (red) for 30 min and then stained for Fas with anti-IgG3 Alexa-488 (green). Arrowheads mark examples of membrane areas with bright patches of Fas and the CTB staining at the same location.
Figure 4.
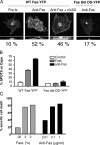
Redistribution of wild-type and mutant Fas-YFP fusion proteins after anti-Fas treatment. (A) Cos-7 cells transiently transfected with the indicated Fas-YFP fusion proteins were treated with 1 μg/ml of APO-1 and 0.1 μg/ml of protein A for 30 min at 37°C and z-stack images of live cells were acquired by confocal microscopy. The top panels show vertical maximum intensity projections of the stacks and the bottom panels show a mid-cell section of the same stack rotated 90°. The numbers underneath each panel are the percentage of cells exhibiting receptor SPOTS after 30 min of anti-Fas mAb treatment. (B) Comparison of SPOTS induced by FasL and anti-Fas. SKW6.4 cells were transiently transfected with the indicated Fas-YFP fusion protein constructs and treated with either anti-Fas mAb or FasL-FLAG with anti-FLAG cross-linking as described in the Patients, cell lines, plasmids, and reagents section in Materials and methods. After 60 min at 37°C, live cells were scored for the presence of SPOTS or caps by a blinded observer in duplicate. The numbers are the average ± SEM for each condition. Without anti-FLAG cross-linking <10% SPOTS or caps were observed (not depicted). (C) Cell death induced in SKW6.4 the same preparations of FasL and anti-Fas as in B. Cell death was measured at 6 h by annexin/PI staining.
Figure 5.
Kinetics of SPOTS formation and internalization of Fas-YFP fusion proteins. (A) Selected frames from a confocal time series of Jurkat cells transfected with wild-type Fas-YFP fusion protein and treated with anti-Fas at the indicated time point (minutes:seconds). Midsection confocal images of the whole cell are shown in the top panels, and an enlarged view of a portion of the plasma membrane is shown at each time point with the intracellular (i) and extracellular (e) compartments in the first frame of each row.
Figure 6.
Dependence of Fas-YFP receptor internalization on the Fas DD and caspase activity. (A) FACS analysis of Fas-YFP internalization in transfected wild-type Jurkat cells after anti-Fas (top) or FasL (bottom) treatment for 2 h. The dashed histograms represent levels of Fas-YFP surface expression before treatment and the solid lines represent levels after treatment. The numbers are the change in geometric mean channel fluorescence between treated and untreated cells for each transfectant, with positive numbers indicating decreased fluorescence and negative numbers an increase after treatment. Populations were gated on viable cells expressing the Fas-YFP fusion protein. The fusion protein constructs are indicated above each panel. (B) FACS analysis of internalization of WT Fas-YFP fusion proteins in Jurkat clones stably overexpressing Bcl-x and v-FLIP and a control clone transfected with the drug-resistance plasmid alone. Results are shown as in A.
Figure 7.
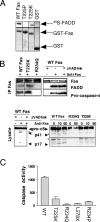
ALPS-associated Fas mutations block SPOTS formation by distinct mechanisms. (A) GST pull-down assay with the indicated mutant Fas DD proteins or GST alone, and 35S-labeled FADD, was performed as described previously (Martin et al., 1999). Vertical black lines divide lanes taken from the same blot. (B) Signaling complex formation and caspase-8 processing in EBV lines from selected Fas mutant ALPS patients and zVAD-fmk treated normal donor-derived cells. EBV cell lines were stimulated with 1 μg/ml of APO-1 anti-Fas mAb for 10 min or the times indicated, and the DISC was immunoprecipitated as described previously (Martin et al., 1999). Caspase-8 cleavage in cell lysates are shown in the bottom panel. Arrowheads denote protein fragments of interest and open circles denote background bands. Vertical black lines divide lanes taken from the same blot. (C) DEVDase effector caspase assay of lysates from EBV-transformed cell lines or ALPS patient EBV cell lines heterozygous for the indicated Fas mutations. Cells were treated for 1 h with 1 μg/ml of APO-1 anti-Fas mAb. Assays were performed as described previously (Martin et al., 1999). Values are the fluorescence of treated minus control for each cell line in arbitrary fluorescence units. Error bars represent the SEM for triplicate measurements.
Figure 8.
ALPS Fas mutations and patient cells display defective SPOTS formation and receptor downmodulation. (A) Cos-7 cells transiently transfected with the indicated Fas-YFP fusion proteins were treated with 1 μg/ml of APO-1 and 0.1 μg/ml of protein A for 30 min at 37°C and z-stack images of live cells were acquired by confocal microscopy and shown as in Fig. 2. (B) EBV-transformed B cell lines from healthy donors or patients with the indicated mutations were treated with anti-Fas for 1 h, stained for Fas as described in Materials and methods, and visually scored for receptor surface clustering or capping, with the total percentage of capped or clustered Fas given below each panel. Mid-cell confocal sections and three-dimensional reconstructions of representative cells are shown for anti-Fas–treated (bottom) or untreated (top) cells. Insets show three-dimensional reconstruction of z-stack images for a representative cell in each condition. The numbers below each panel represent the percentage of cells exhibiting SPOTS or caps after anti-Fas treatment. (C) Quantitation of surface Fas after treatment of the indicated EBV patient-derived cells with anti-Fas and normal cells treated with or without the zVAD-fmk caspase inhibitor.
Similar articles
- Isolation and analysis of components of CD95 (APO-1/Fas) death-inducing signaling complex.
Scaffidi C, Krammer PH, Peter ME. Scaffidi C, et al. Methods. 1999 Apr;17(4):287-91. doi: 10.1006/meth.1999.0742. Methods. 1999. PMID: 10196099 - The multifaceted role of Fas signaling in immune cell homeostasis and autoimmunity.
Siegel RM, Chan FK, Chun HJ, Lenardo MJ. Siegel RM, et al. Nat Immunol. 2000 Dec;1(6):469-74. doi: 10.1038/82712. Nat Immunol. 2000. PMID: 11101867 Review. - Apoptosis-related factors (Fas receptor, Fas ligand, FADD) in early tooth development of the field vole (Microtus agrestis).
Matalova E, Tucker AS, Misek I. Matalova E, et al. Arch Oral Biol. 2005 Feb;50(2):165-9. doi: 10.1016/j.archoralbio.2004.10.012. Epub 2004 Dec 31. Arch Oral Biol. 2005. PMID: 15721145 - Homotypic FADD interactions through a conserved RXDLL motif are required for death receptor-induced apoptosis.
Muppidi JR, Lobito AA, Ramaswamy M, Yang JK, Wang L, Wu H, Siegel RM. Muppidi JR, et al. Cell Death Differ. 2006 Oct;13(10):1641-50. doi: 10.1038/sj.cdd.4401855. Epub 2006 Jan 20. Cell Death Differ. 2006. PMID: 16410793 - The CD95(APO-1/Fas) DISC and beyond.
Peter ME, Krammer PH. Peter ME, et al. Cell Death Differ. 2003 Jan;10(1):26-35. doi: 10.1038/sj.cdd.4401186. Cell Death Differ. 2003. PMID: 12655293 Review.
Cited by
- Tumor necrosis factor-related apoptosis-inducing ligand (TRAIL) induces death receptor 5 networks that are highly organized.
Valley CC, Lewis AK, Mudaliar DJ, Perlmutter JD, Braun AR, Karim CB, Thomas DD, Brody JR, Sachs JN. Valley CC, et al. J Biol Chem. 2012 Jun 15;287(25):21265-78. doi: 10.1074/jbc.M111.306480. Epub 2012 Apr 10. J Biol Chem. 2012. PMID: 22496450 Free PMC article. - Enhancement of the proapoptotic properties of newcastle disease virus promotes tumor remission in syngeneic murine cancer models.
Cuadrado-Castano S, Ayllon J, Mansour M, de la Iglesia-Vicente J, Jordan S, Tripathi S, García-Sastre A, Villar E. Cuadrado-Castano S, et al. Mol Cancer Ther. 2015 May;14(5):1247-58. doi: 10.1158/1535-7163.MCT-14-0913. Epub 2015 Mar 11. Mol Cancer Ther. 2015. PMID: 25761895 Free PMC article. - Therapeutic approaches targeting CD95L/CD95 signaling in cancer and autoimmune diseases.
Risso V, Lafont E, Le Gallo M. Risso V, et al. Cell Death Dis. 2022 Mar 17;13(3):248. doi: 10.1038/s41419-022-04688-x. Cell Death Dis. 2022. PMID: 35301281 Free PMC article. Review. - The SCHOOL of nature: I. Transmembrane signaling.
Sigalov AB. Sigalov AB. Self Nonself. 2010 Jan;1(1):4-39. doi: 10.4161/self.1.1.10832. Self Nonself. 2010. PMID: 21559175 Free PMC article. - Life and death by death receptors.
Guicciardi ME, Gores GJ. Guicciardi ME, et al. FASEB J. 2009 Jun;23(6):1625-37. doi: 10.1096/fj.08-111005. Epub 2009 Jan 13. FASEB J. 2009. PMID: 19141537 Free PMC article. Review.
References
- Banner, D.W., A. D'Arcy, W. Janes, R. Gentz, H.J. Schoenfeld, C. Broger, H. Loetscher, and W. Lesslauer. 1993. Crystal structure of the soluble human 55 kd TNF receptor-human TNF beta complex: implications for TNF receptor activation. Cell. 73:431–445. - PubMed
- Boatright, K.M., M. Renatus, F.L. Scott, S. Sperandio, H. Shin, I.M. Pedersen, J.E. Ricci, W.A. Edris, D.P. Sutherlin, D.R. Green, and G.S. Salvesen. 2003. A unified model for apical caspase activation. Mol. Cell. 11:529–541. - PubMed
- Chan, F.K., H.J. Chun, L. Zheng, R.M. Siegel, K.L. Bui, and M.J. Lenardo. 2000. A domain in TNF receptors that mediates ligand-independent receptor assembly and signaling. Science. 288:2351–2354. - PubMed
- Cock, J.G., A.D. Tepper, E. de Vries, W.J. van Blitterswijk, and J. Borst. 1998. CD95 (Fas/APO-1) induces ceramide formation and apoptosis in the absence of a functional acid sphingomyelinase. J. Biol. Chem. 273:7560–7565. - PubMed
MeSH terms
Substances
LinkOut - more resources
Full Text Sources
Other Literature Sources
Research Materials
Miscellaneous


