The role of the kinesin motor KipA in microtubule organization and polarized growth of Aspergillus nidulans - PubMed (original) (raw)
The role of the kinesin motor KipA in microtubule organization and polarized growth of Aspergillus nidulans
Sven Konzack et al. Mol Biol Cell. 2005 Feb.
Abstract
Polarized growth in filamentous fungi requires the integrity of the microtubule (MT) cytoskeleton. We found that growing MTs in Aspergillus nidulans merge at the center of fast growing tips and discovered that a kinesin motor protein, KipA, related to Tea2p of Schizosaccharomyces pombe, is required for this process. In a DeltakipA strain, MT plus ends reach the tip but show continuous lateral movement. Hyphae lose directionality and grow in curves, apparently due to mislocalization of the vesicle supply center (Spitzenkörper) in the apex. Green fluorescent protein (GFP)-KipA accumulates at MT plus ends, whereas a KipA rigor mutant protein, GFP-KipA(G223E), coated MTs evenly. These findings suggest that KipA requires its intrinsic motor activity to reach the MT plus end. Using KipA as an MT plus-end marker, we found bidirectional organization of MTs and determined the locations of microtubule organizing centers at nuclei, in the cytoplasm, and at septa.
Figures
Figure 1.
Characterization of KipA. (A) Scheme of the genomic locus and the KipA protein (accession no. AJ622826). Arrow, intron; red, motor domain; blue, coiled-coil regions; black, ATP binding site; light blue, the microtubule-binding-pocket. (B) A most likely phylogenetic tree of kinesins belonging to four different subfamilies was built by comparison of their motor domains by using Tree-puzzle (
) and a maximum-likelihood algorithm. For evaluation of statistical significance of the topology, 25,000 replicating puzzling steps were performed. The substitution model Whelan-Goldman 2000 was used because it produced a consensus tree, as shown, which is in good agreement with the published data (Schoch et al., 2003). The kinesins shown are from the indicated organisms: An, A. nidulans; Nc, Neurospora crassa; Spo, S. pombe; Ce, Caenorhabditis elegans; Mm, Mus musculus; Um, Ustilago maydis; Sc, S. cerevisiae; Ch, Cochliobolus heterostrophus; Hs, Homo sapiens; Ca, Candida albicans; Dm, Drosophila melanogaster. The A. nidulans and N. crassa sequences were taken from the annotated genome sequence database at the Whitehead Institute. (C) Comparison of the protein architecture of KipA and related kinesins. Domains are indicated as in A.
Figure 2.
Morphological phenotypes of kipA mutants. (A and B) Differential interference contrast images of wild-type hyphae (RMS011) (A) and Δ_kipA_ hyphae (SSK44) (B). (C) Phase-contrast images of alcA(p)-GFP-kipA strain SSK92 under inducing (threonine) and repressing (glucose) conditions. (D) Effect of kipA deletion on the establishment of polarity. Conidia of wild-type (RMS011) and Δ_kipA_ (SSK13) strains were germinated and analyzed for the direction of second germ tube formation. For each strain, 200 germlings were counted.
Figure 3.
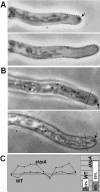
Mispositioning of the SPK in a kipA mutant. (A) Correlation between SPK position and growth direction. Top, noncentral SPK (arrow) in a hypha of Δ_kipA_ mutant strain SSK13. Bottom, 5 min later, growth has occurred in the direction of the noncentral SPK. (B) Determination of SPK position in wild-type (top, RMS011) and Δ_kipA_ mutant (bottom, SSK44) hyphae. The center of the tip and central axis of the hypha were defined as indicated by the lines, and SPK position was determined by measuring the distance from the center of the SPK to the central axis and expressing the value as a percentage of the radius of the hypha (i.e., the distance from the central axis to the outer edge of the hypha at the position indicated by the line perpendicular to the central axis). (C, left) Examples of tracks of SPKs in wild-type (RMS011) and Δ_kipA_ (SSK44) strains. The shaded box represents (top to bottom) half the diameter of the hypha in each case; the straight line represents its central axis and a time period of 10 min over which measurements were made. (C, right) Summary of data for 129 measurements (17 germlings) on strain RMS011 and 121 measurements (28 germlings) on strain SSK44. The average (shaded box) and maximum (white box) distances of the SPK from the central axis are indicated. Note that, in some cases, the SPKs moved considerably further from the central axis than seen in the typical tracks shown on the left.
Figure 4.
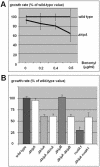
Comparison of growth and benomyl sensitivity of wild-type and mutant strains. (A) Wild-type (RMS011) and Δ_kipA_ (SSK44) conidia were spotted at the centers of agar plates containing different concentrations of benomyl. Colony diameters were measured after 2 d at 37°C, and the value for wild type at that concentration was used as 100% (10 colonies per strain for each concentration). (B) Wild-type and mutant strains were grown for 2 d at 30°C, and the diameters of 25 colonies per strain were measured. The strains used were RMS011, SSK44, SNR3, SSK72, SPR36, SSK73, XX3, and SSK80 (see Table 1).
Figure 5.
GFP-KipA localization in interphase cells. Strains SSK92 (A and B, top sequence), SJW02 (B, bottom sequence), and SSK100 (C) were grown on glycerol to derepress expression of the GFP-tagged proteins without overexpressing them. (A) Localization of GFP-KipA. Left, phase contrast; right, GFP; arrows, the location of septa. (B) Top sequence, movement of GFP-KipA spots (arrows) toward the tip of the hypha. Times are indicated in seconds. Bottom sequence, GFP-labeled MTs in a hyphal tip. The MT on the left grows, pauses at the tip, and retracts after a catastrophe event. In comparison, the GFP-KipA signal disappears without retracting after reaching the tip (see Movies 1 and 2). (C) Localization of GFP-KipA at the plus ends of mRFP1-decorated MTs. Top and bottom rows show two different germlings. Left, mRFP1 fluorescence; MTs are visible as fibers. Middle, 3 s after the first exposure, the fluorescence channel was changed to visualize GFP-KipA. Right, overlay of the colored images. Arrows indicate positions in the MT bundle at which the mRFP1 fluorescence intensity decreases (left) and at which GFP-KipA is concentrated (middle).
Figure 6.
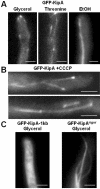
Localization of GFP-KipA and the rigor mutant GFP-KipAG223E. (A) GFP-KipA labels MT plus ends when expressed at low levels and the entire MTs when overexpressed. Strain SSK92 was grown at 25°C on glycerol or threonine for 1 d or on ethanol for 2 d. (B) GFP-KipA staining of MTs and MT plus ends 20 min after addition of CCCP to strain SSK100 growing on glycerol medium at 25°C. Comet-like structures were not observed. (C) GFP-KipAG223E stains entire MTs. Ectopic integration of the construct led to staining of the cytoplasm (left), whereas homologous integration led to production of full-length GFP-KipAG223E and coating of the entire MTs. The images were taken after strains SSK116 and SSK114 were grown for 1 d on glycerol.
Figure 7.
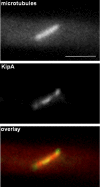
GFP-KipA localization during mitosis. Strain SSK100 was grown on glycerol for one day at 25°C and observed for mRFP1-KipB (top) and GFP-KipA (middle). The bottom panel shows the overlaid images.
Figure 8.
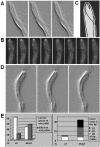
MT organization in growing hyphal tips of wild type and a Δ_kipA_ mutant (see Movies 2-5). (A-C) Wild-type strain SJW02 was grown on glycerol at 25°C. (A) GFP-labeled MTs are displayed in shadow mode in images captured at 3-s intervals. (B) GFP-KipA images captured at 2-s intervals. The disappearance of tip signal in image 5 and its reappearance in image 6 suggests that the maintenance of KipA at the tip requires continuous delivery from the plus ends. (C) Scheme of the traces of GFP-KipA. During an observation time of 4 min, 18 MT plus ends used the same tracks indicated with lines. (D) Δ_kipA_ strain SSK67 was grown on glycerol at 25°C and imaged as in A. (E) Quantification of the effects. Left, data from 157 MTs in 27 germlings of strain SJW02 and from 151 MTs in 29 germlings of strain SSK67. Right, in the same dataset, the movements of MT plus ends away from their meeting point were measured and grouped into short, medium, and long movements.
Figure 10.
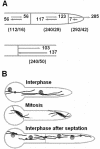
MTOCs and MT organization during the cell cycle. (A) Quantitation of the orientation of the MTs. The numbers of MTs counted and the numbers of germlings are denoted below the hyphae in parentheses. Top scheme, MTs have mixed polarities in various compartments. In the very tip (indicated with a dashed line), most MTs are oriented with their plus ends toward the tip. Bottom scheme, MTs growing away from the septum and MTs ending at the septum. (B) Summary of MTOC organization during early growth of a germling. Black lines, MTs; small circles, MTOCs; large circles, nuclei.
Figure 9.
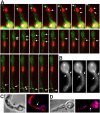
MTOCs at nuclei, in the cytoplasm, and at septa. (A) Images from movie sequences at different regions of one germling of strain SSK99 showing several GFP-KipA signals (green) originating from MTOCs at the nucleus (top row), in the cytoplasm (middle row), and at a septum (bottom row). Each sequence covered a period of ∼40 s; images were recorded at 2-s intervals, but only selected images are shown. The crosses indicate the MTOCs and the arrows point to growing MT plus ends. During each period of observation, two to three spots are moving away from the MTOC (see Movies 6-8). (B) Young germling of strain SJW02 with GFP-labeled MTs. The arrows point to two MTs emanating from an MTOC at the septum. Pictures were taken at 3-s intervals (see Movie 9). (C and D) Immunostaining of MTs (C) and γ-tubulin (D) in young germlings of strain RMS011. Nuclei were stained with DAPI. The arrows point to the septa. MTs do not continue through the septa (C). γ-Tubulin signals are visible at the nucleus and at the septum (D).
Similar articles
- Aspergillus nidulans Dis1/XMAP215 protein AlpA localizes to spindle pole bodies and microtubule plus ends and contributes to growth directionality.
Enke C, Zekert N, Veith D, Schaaf C, Konzack S, Fischer R. Enke C, et al. Eukaryot Cell. 2007 Mar;6(3):555-62. doi: 10.1128/EC.00266-06. Epub 2007 Jan 19. Eukaryot Cell. 2007. PMID: 17237365 Free PMC article. - The Aspergillus nidulans kinesin-3 UncA motor moves vesicles along a subpopulation of microtubules.
Zekert N, Fischer R. Zekert N, et al. Mol Biol Cell. 2009 Jan;20(2):673-84. doi: 10.1091/mbc.e08-07-0685. Epub 2008 Nov 26. Mol Biol Cell. 2009. PMID: 19037104 Free PMC article. - Microtubule plus end-tracking proteins play critical roles in directional growth of hyphae by regulating the dynamics of cytoplasmic microtubules in Aspergillus nidulans.
Zeng CJ, Kim HR, Vargas Arispuro I, Kim JM, Huang AC, Liu B. Zeng CJ, et al. Mol Microbiol. 2014 Nov;94(3):506-21. doi: 10.1111/mmi.12792. Epub 2014 Oct 6. Mol Microbiol. 2014. PMID: 25213466 - Polarized growth in fungi--interplay between the cytoskeleton, positional markers and membrane domains.
Fischer R, Zekert N, Takeshita N. Fischer R, et al. Mol Microbiol. 2008 May;68(4):813-26. doi: 10.1111/j.1365-2958.2008.06193.x. Epub 2008 Apr 8. Mol Microbiol. 2008. PMID: 18399939 Review. - Interdependence of the actin and the microtubule cytoskeleton during fungal growth.
Takeshita N, Manck R, Grün N, de Vega SH, Fischer R. Takeshita N, et al. Curr Opin Microbiol. 2014 Aug;20:34-41. doi: 10.1016/j.mib.2014.04.005. Epub 2014 May 27. Curr Opin Microbiol. 2014. PMID: 24879477 Review.
Cited by
- Kinesin Motors in the Filamentous Basidiomycetes in Light of the Schizophyllum commune Genome.
Raudaskoski M. Raudaskoski M. J Fungi (Basel). 2022 Mar 12;8(3):294. doi: 10.3390/jof8030294. J Fungi (Basel). 2022. PMID: 35330296 Free PMC article. Review. - Ras GTPase-activating protein regulation of actin cytoskeleton and hyphal polarity in Aspergillus nidulans.
Harispe L, Portela C, Scazzocchio C, Peñalva MA, Gorfinkiel L. Harispe L, et al. Eukaryot Cell. 2008 Jan;7(1):141-53. doi: 10.1128/EC.00346-07. Epub 2007 Nov 26. Eukaryot Cell. 2008. PMID: 18039943 Free PMC article. - Distinct ceramide synthases regulate polarized growth in the filamentous fungus Aspergillus nidulans.
Li S, Du L, Yuen G, Harris SD. Li S, et al. Mol Biol Cell. 2006 Mar;17(3):1218-27. doi: 10.1091/mbc.e05-06-0533. Epub 2006 Jan 4. Mol Biol Cell. 2006. PMID: 16394102 Free PMC article. - The tip growth apparatus of Aspergillus nidulans.
Taheri-Talesh N, Horio T, Araujo-Bazán L, Dou X, Espeso EA, Peñalva MA, Osmani SA, Oakley BR. Taheri-Talesh N, et al. Mol Biol Cell. 2008 Apr;19(4):1439-49. doi: 10.1091/mbc.e07-05-0464. Epub 2008 Jan 23. Mol Biol Cell. 2008. PMID: 18216285 Free PMC article. - Harnessing Fungi Signaling in Living Composites.
Schyck S, Marchese P, Amani M, Ablonczy M, Spoelstra L, Jones M, Bathaei Y, Bismarck A, Masania K. Schyck S, et al. Glob Chall. 2024 Jul 12;8(8):2400104. doi: 10.1002/gch2.202400104. eCollection 2024 Aug. Glob Chall. 2024. PMID: 39469481 Free PMC article.
References
- Bartnicki-Garcia, S., Bartnicki, D. D., Gierz, G., Lopez-Franco, R., and Bracker, C. E. (1995). Evidence that Spitzenkörper behavior determines the shape of a fungal hypha: a test of the hyphoid model. Exp. Mycol. 19, 153-159. - PubMed
- Bloom, K. (2000). It's a kar9ochore to capture microtubules. Nat. Cell Biol. 2, E96-E98. - PubMed
- Browning, H., Hackney, D. D., and Nurse, P. (2003). Targeted movement of cell end factors in fission yeast. Nat. Cell Biol. 5, 812-818. - PubMed
Publication types
MeSH terms
Substances
LinkOut - more resources
Full Text Sources
Other Literature Sources
Molecular Biology Databases
Miscellaneous


