Regulation of HCN channel surface expression by a novel C-terminal protein-protein interaction - PubMed (original) (raw)
Regulation of HCN channel surface expression by a novel C-terminal protein-protein interaction
Bina Santoro et al. J Neurosci. 2004.
Abstract
Hyperpolarization-activated cation currents (I(h)) are carried by channels encoded by a family of four genes (HCN1-4) that are differentially expressed within the brain in specific cellular and subcellular compartments. HCN1 shows a high level of expression in apical dendrites of cortical pyramidal neurons and in presynaptic terminals of cerebellar basket cells, structures with a high density of I(h). Expression of I(h) is also regulated by neuronal activity. To isolate proteins that may control HCN channel expression or function, we performed yeast two-hybrid screens using the C-terminal cytoplasmic tails of the HCN proteins as bait. We identified a brain-specific protein, which has been previously termed TRIP8b (for TPR-containing Rab8b interacting protein) and PEX5Rp (for Pex5p-related protein), that specifically interacts with all four HCN channels through a conserved sequence in their C-terminal tails. In situ hybridization and immunohistochemistry show that TRIP8b and HCN1 are colocalized, particularly within dendritic arbors of hippocampal CA1 and neocortical layer V pyramidal neurons. The dendritic expression of TRIP8b in layer V pyramidal neurons is disrupted after deletion of HCN1 through homologous recombination, demonstrating a key in vivo interaction between HCN1 and TRIP8b. TRIP8b dramatically alters the trafficking of HCN channels heterologously expressed in Xenopus oocytes and human embryonic kidney 293 cells, causing a specific decrease in surface expression of HCN protein and I(h) density, with a pronounced intracellular accumulation of HCN protein that is colocalized in discrete cytoplasmic clusters with TRIP8b. Finally, TRIP8b expression in cultured pyramidal neurons markedly decreases native I(h) density. These data suggest a possible role for TRIP8b in regulating HCN channel density in the plasma membrane.
Figures
Figure 1.
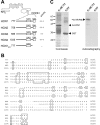
HCN channel proteins interact with TRIP8b through their conserved C-terminal end. A, Schematic representation of HCN baits used in the yeast two-hybrid screen and their respective activation of a GFP reporter gene in the presence of the TRIP8b target construct. Numbers on the left indicate the N-terminal starting position of bait construct in the HCN protein sequence. B, Alignment of the regions corresponding to the HCN baits. Numbers on the left indicate starting position (the HCN3 bait construct extends to position 586). C, GST pull-down assay. The panel on the left shows a Coomassie stain of protein product eluted from glutathione-agarose beads after incubation with in vitro translated TRIP8b; beads carried either a GST-HCN1 fusion protein (G-HCN1, amino acids 777-910) or a control GST protein (GST). Corresponding bands are indicated (arrows), demonstrating equal loading of beads. The panel on the right shows an autoradiogram from the same gel, with the 35S-signal corresponding to the full-length TRIP8b protein. Protein molecular weight markers are indicated on the left (in kilodaltons).
Figure 2.
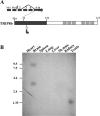
Domain structure and tissue distribution of TRIP8b. A, Schematic representation of the TRIP8b protein. The N-terminal domain, having no known homology to other proteins, is represented by a dark gray box; the C-terminal domain contains six TPRs represented by light grayboxes. Numbers indicate positions in the protein sequence. The starting point of the TRIP8b partial clone isolated in the yeast two-hybrid screen is indicated (arrow at position 77; clone extends through the C-terminal end of protein). Inset on the top illustrates the intron-exon structure of the TRIP8b gene and the splicing isoform used in this study. Exons are labeled by numbers; starting methionines are labeled “Met.” No alternative splicing was found after exon 5 through exon 16, which contains the stop codon. B, Northern blot analysis of TRIP8b mRNA expression in mouse tissues. The probe, corresponding to amino acids 467-600, recognizes all alternatively spliced isoforms. RNA molecular weight markers are indicated on the left (in kilobases). The significance of the shorter transcript in testis is unclear, because its size is insufficient to encode a full-length protein.
Figure 3.
In situ hybridization analysis of TRIP8b mRNA expression in the mouse brain. A, C, Sections hybridized with an HCN1 probe. B,D, Sections hybridized with a TRIP8b probe. Sections in A and B are consecutive sagittal sections; sections in C and D are also consecutive but collected in a more medial position.
Figure 4.
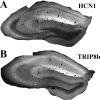
Immunohistochemical analysis of TRIP8b protein expression in mouse hippocampus. A, Anti-HCN1 antibody staining obtained by immunofluorescence on a coronal brain section (40 μm) from a wild-type mouse. B, Anti-TRIP8b antibody staining obtained by immunofluorescence on a serial coronal brain section (40 μm) from a wild-type mouse. Imaging was performed by confocal microscopy (10× objective); all images represent a single focal plane and were collected at the point of maximum labeling intensity for each section.
Figure 5.
Immunohistochemical analysis of TRIP8b protein expression in neocortex of a wild-type mouse and a mouse line with an unrestricted deletion of HCN1. A, C, Anti-HCN1 antibody staining obtained by immunofluorescence on a coronal brain section (40 μm) from a wild-type (A) or an HCN1-/- (C) mouse. B, D, Anti-TRIP8b antibody staining obtained by immunofluorescence on a serial coronal brain section (40 μm) from a wild-type (B) or HCN1-/- (D) mouse. Arrowheads show the location of somata, and arrows indicate the location of apical dendrites from layer V pyramidal neurons. Imaging was performed by confocal microscopy (10× objective); all images represent a single focal plane and were collected at the point of maximum labeling intensity for each section, using identical settings for samples in A and C and in B and D, respectively.
Figure 6.
Double-immunofluorescence labeling of TRIP8b and HCN1 protein expression in the neocortex of mice with a forebrain-restricted deletion of HCN1 (HCN1f/f,cre) and matched littermates with normal HCN1 expression (HCN1f/f). A,C, Confocal image (40× objective) of FITC signal as a marker of anti-HCN1 antibody staining on a coronal brain section (40 μm) from an HCN1f/f (A) or an HCN1f/f,cre (C) mouse. B, D, Corresponding confocal image of rhodamine-red signal as a marker of anti-TRIP8b antibody staining in the same area, from an HCN1f/f (B) or an HCN1f/f,cre (D) mouse. All images represent a single focal plane. Images in A and C were taken under identical conditions and illustrate the dramatic reduction of HCN1 labeling in the apical dendrites from layer V neurons of the HCN1f/f,cre mice. Images in B and D were also taken under identical conditions and illustrate the correspondingly strong reduction of TRIP8b labeling in the apical dendrites from the HCN1f/f,cre mouse. E-G, Colocalization of HCN1 and TRIP8b protein in the apical dendrites of layer V pyramidal neurons. Confocal images (40× objective) of FITC labeling for HCN1 (E) and rhodamine-red labeling for TRIP8b (F) on the same brain section from an HCN1f/f,cre mouse, together with a merged image (G) demonstrating colabeling (yellow) of the same dendritic processes by both antibodies. Note that illumination settings were greatly increased with respect to images in _A_-D to enhance detection of residual dendritic label.
Figure 7.
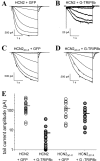
TRIP8b expression strongly reduces HCN2 currents in cell-attached patches. A-D, Sample current traces from Xenopus oocytes coinjected with cRNA encoding HCN2 and GFP (A), HCN2 and GFP-TRIP8b (B), HCN2ΔC-X and GFP (C), HCN2ΔC-X and GFP-TRIP8b (D). Currents elicited by 3 sec hyperpolarizations from a holding potential of -30 mV to a range of test potentials between -75 and -145 mV, in increments of 10 mV. Note differences in current scale bars. E, Plot of maximal tail-current amplitude (measured at -40 mV). For each patch, tail-current activation curves were fit with a Boltzmann equation (see Materials and Methods) to obtain the tail-current amplitude. Each point corresponds to a single patch recording, and only one patch was taken from each oocyte. Note logarithmic _y_-axis scale. Horizontal bar shows mean current under each condition.
Figure 8.
TRIP8b specifically suppresses HCN1 currents in whole-cell recordings. A, Data obtained from oocytes injected with wild-type HCN1 and coinjected with either GFP (left) or GFP-TRIP8b fusion protein cRNAs (right). B, Data from oocytes injected with HCN1ΔSNL truncation mutant and coinjected with either GFP (left) or GFP-TRIP8b cRNAs (right). C, Data from oocytes injected with KAT1 and coinjected with either GFP (left) or GFP-TRIP8b cRNAs (right). Top, Plots of maximal tail-current amplitude obtained as in Figure 7_E_ for HCN constructs. For KAT1, tail-current amplitude was measured at -40 mV after a step to -115 mV. Each point represents data from a single oocyte. Bottom, Sample current traces from two-microelectrode voltage-clamp recordings from Xenopus oocytes coinjected with cRNAs encoding the indicated gene products. Currents were elicited by 3 sec hyperpolarizations from a holding potential of -30mV to a range of test potentials between -35 and -105mV, in increments of 10 mV.
Figure 9.
Trafficking of HCN channels is altered in oocytes coexpressing TRIP8b. The orientation of each oocyte is schematically shown at the side of each panel (black, animal pole; white, vegetal pole). A, Confocal image of oocyte injected with cRNA encoding GFP-HCN2 fusion protein, in the presence (right) or absence (left) of TRIP8b. Note substantial fluorescence in vegetal pole after coexpression with TRIP8b. Only protein in the vegetal pole of the oocyte is visible, because of the dark pigmentation of the Xenopus oocyte animal pole. B, Confocal image of oocyte injected with cRNA encoding GFP-CNGA1 fusion protein, in the presence (right) or absence (left) of TRIP8b. All images are single planes taken approximately perpendicular to the equatorial line dividing the animal from vegetal pole.
Figure 10.
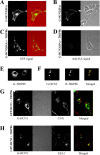
Coexpression of TRIP8b results in the intracellular accumulation of HCN channels. HEK293 cells were transfected with constructs indicated on the left of each panel, or as specified. A, C, Confocal images of GFP signal as marker of total GFP-HCN2 fusion protein expression. Images on left show GFP fluorescence alone. Images on right (red background) represent merged transmitted light image, with cell outlines in red and GFP fluorescence image in green. B, D, Confocal images of surface expression of HA epitope-tagged GFP-HCN2 protein. Fluorescence images on the left show staining after intact cells were labeled with an anti-HA antibody followed by detection with a rhodamine-conjugated secondary antibody. Images on the right show transmitted light. Note complete loss of surface staining after coexpression with TRIP8b. E, Confocal image of GFP fluorescence from cell transfected with GFP-TRIP8b protein alone. Note diffuse cytoplasmic staining. F, Colocalization of HCN protein and TRIP8b protein in HEK293 cells cotransfected with GFP-HCN2 and DsRed-TRIP8b. Left, Confocal image of GFP fluorescence indicating localization of HCN2. Middle, Image of DsRed fluorescence representing TRIP8b. Right, Merged image of GFP and DsRed fluorescence (with yellow representing overlapping green and red signals). G, H, Colocalization of internalized HCN protein and internal membrane compartments after coexpression of GFP-HCN1 or GFP-HCN2 with TRIP8b. HEK293 cells were cotransfected with HCN protein and TRIP8b as indicated, permeabilized, and stained using either anti-CNX antibodies to label the endoplasmic reticulum (G) or antibodies to EEA1 to label early endosomes (H). Confocal image comparing the GFP signal, representing HCN1 (G) or HCN2 (H) channel expression and the rhodamine-red signal, representing internal membrane markers. Middle images show transmitted light. Merged images of GFP and rhodamine signals are shown on the extreme right.
Figure 11.
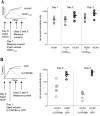
TRIP8b expression decreases the half-life of HCN channels expressed on the plasma membrane of Xenopus oocytes. _A,Determination of HCN current stability after block of new functional channel synthesis. Schematic of experiment is shown on the left (see Results for explanation). On day 0, oocytes were injected with an HCN1 cRNA. Twenty-four hours later on day 1, oocytes either were injected with cRNA for an HCN1AAA dominant-negative constructor received no injection. Solid line indicates predicted continuous increase in total current after HCN1 cRNA injection on day 0 for oocytes that were not coinjected with HCN1AAA. The dashed line shows predicted stable current level for oocytes injected with HCN1AAA on day 1 if rate of membrane turnover is slow. Dotted line shows predicted decrease in HCN1 current after injection of HCN1AAA if membrane turnover is fast. Experimental data are shown on the right. Plot of maximal tail-current amplitudes was obtained as in Figure 7_E from two-electrode recordings. Note relative stability of HCN current after injection of HCN1AAA, indicating slow rate of membrane turnover. B, Rate of HCN channel turnover increased after expression of TRIP8b. Schematic of experiment is shown on the left (see Results for explanation). Experiment is similar to that shown in A, except either GFP-TRIP8b or GFP is injected on day 1, instead of HCN1AAA. Solid line indicates prediction for GFP-injected control oocytes; broken lines indicates two possible outcomes after TRIP8b injection. If TRIP8b only blocks insertion of newly synthesized protein, current should resemble that seen using HCN1AAA (dashed line). If TRIP8b enhances channel internalization, then we predict an accelerated loss of current (dotted line). Experimental tail-current data are shown on the right. Note greatly increased loss of HCN current after injection of TRIP8b, compared with injection of GFP alone or HCN1AAA (A).
Figure 12.
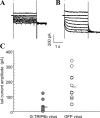
TRIP8b suppresses native _I_h currents in hippocampal neurons. A, B, Sample whole-cell patch recordings from cultured hippocampal pyramidal neurons, obtained 24 hr after infection with Sindbis virus expressing either GFP-TRIP8b (A) or GFP alone (B). Cells were held at -55 mV, and currents were elicited by voltage steps from -45 to -115 mV, in increments of 10 mV. C, Plot of tail-current amplitude of Boltzmann fits (one point per cell, as before) after tail current measurement at -115 mV.
Similar articles
- Deletion of the hyperpolarization-activated cyclic nucleotide-gated channel auxiliary subunit TRIP8b impairs hippocampal Ih localization and function and promotes antidepressant behavior in mice.
Lewis AS, Vaidya SP, Blaiss CA, Liu Z, Stoub TR, Brager DH, Chen X, Bender RA, Estep CM, Popov AB, Kang CE, Van Veldhoven PP, Bayliss DA, Nicholson DA, Powell CM, Johnston D, Chetkovich DM. Lewis AS, et al. J Neurosci. 2011 May 18;31(20):7424-40. doi: 10.1523/JNEUROSCI.0936-11.2011. J Neurosci. 2011. PMID: 21593326 Free PMC article. - Alternatively spliced isoforms of TRIP8b differentially control h channel trafficking and function.
Lewis AS, Schwartz E, Chan CS, Noam Y, Shin M, Wadman WJ, Surmeier DJ, Baram TZ, Macdonald RL, Chetkovich DM. Lewis AS, et al. J Neurosci. 2009 May 13;29(19):6250-65. doi: 10.1523/JNEUROSCI.0856-09.2009. J Neurosci. 2009. PMID: 19439603 Free PMC article. - Trafficking and gating of hyperpolarization-activated cyclic nucleotide-gated channels are regulated by interaction with tetratricopeptide repeat-containing Rab8b-interacting protein (TRIP8b) and cyclic AMP at distinct sites.
Han Y, Noam Y, Lewis AS, Gallagher JJ, Wadman WJ, Baram TZ, Chetkovich DM. Han Y, et al. J Biol Chem. 2011 Jun 10;286(23):20823-34. doi: 10.1074/jbc.M111.236125. Epub 2011 Apr 19. J Biol Chem. 2011. PMID: 21504900 Free PMC article. - Neurophysiology of HCN channels: from cellular functions to multiple regulations.
He C, Chen F, Li B, Hu Z. He C, et al. Prog Neurobiol. 2014 Jan;112:1-23. doi: 10.1016/j.pneurobio.2013.10.001. Epub 2013 Oct 29. Prog Neurobiol. 2014. PMID: 24184323 Review. - Cortical HCN channels: function, trafficking and plasticity.
Shah MM. Shah MM. J Physiol. 2014 Jul 1;592(13):2711-9. doi: 10.1113/jphysiol.2013.270058. Epub 2014 Apr 22. J Physiol. 2014. PMID: 24756635 Free PMC article. Review.
Cited by
- Single channel properties of hyperpolarization-activated cation currents in acutely dissociated rat hippocampal neurones.
Simeone TA, Rho JM, Baram TZ. Simeone TA, et al. J Physiol. 2005 Oct 15;568(Pt 2):371-80. doi: 10.1113/jphysiol.2005.093161. Epub 2005 Aug 25. J Physiol. 2005. PMID: 16123099 Free PMC article. - The VAMP-associated protein VAPB is required for cardiac and neuronal pacemaker channel function.
Silbernagel N, Walecki M, Schäfer MK, Kessler M, Zobeiri M, Rinné S, Kiper AK, Komadowski MA, Vowinkel KS, Wemhöner K, Fortmüller L, Schewe M, Dolga AM, Scekic-Zahirovic J, Matschke LA, Culmsee C, Baukrowitz T, Monassier L, Ullrich ND, Dupuis L, Just S, Budde T, Fabritz L, Decher N. Silbernagel N, et al. FASEB J. 2018 Nov;32(11):6159-6173. doi: 10.1096/fj.201800246R. Epub 2018 Jun 7. FASEB J. 2018. PMID: 29879376 Free PMC article. - Reelin signaling specifies the molecular identity of the pyramidal neuron distal dendritic compartment.
Kupferman JV, Basu J, Russo MJ, Guevarra J, Cheung SK, Siegelbaum SA. Kupferman JV, et al. Cell. 2014 Sep 11;158(6):1335-1347. doi: 10.1016/j.cell.2014.07.035. Epub 2014 Sep 4. Cell. 2014. PMID: 25201528 Free PMC article. - An N-terminal deletion variant of HCN1 in the epileptic WAG/Rij strain modulates HCN current densities.
Wemhöner K, Kanyshkova T, Silbernagel N, Fernandez-Orth J, Bittner S, Kiper AK, Rinné S, Netter MF, Meuth SG, Budde T, Decher N. Wemhöner K, et al. Front Mol Neurosci. 2015 Nov 3;8:63. doi: 10.3389/fnmol.2015.00063. eCollection 2015. Front Mol Neurosci. 2015. PMID: 26578877 Free PMC article. - HCN Channel Phosphorylation Sites Mapped by Mass Spectrometry in Human Epilepsy Patients and in an Animal Model of Temporal Lobe Epilepsy.
Concepcion FA, Khan MN, Ju Wang JD, Wei AD, Ojemann JG, Ko AL, Shi Y, Eng JK, Ramirez JM, Poolos NP. Concepcion FA, et al. Neuroscience. 2021 Apr 15;460:13-30. doi: 10.1016/j.neuroscience.2021.01.038. Epub 2021 Feb 9. Neuroscience. 2021. PMID: 33571596 Free PMC article.
References
- Arikkath J, Campbell KP (2003) Auxiliary subunits: essential components of the voltage-gated calcium channel complex. Curr Opin Neurobiol 13: 298-307. - PubMed
- Bender RA, Brewster A, Santoro B, Ludwig A, Hofmann F, Biel M, Baram TZ (2001) Differential and age-dependent expression of hyperpolarization-activated, cyclic nucleotide-gated cation channel isoforms 1-4 suggests evolving roles in the developing rat hippocampus. Neuroscience 106: 689-698. - PMC - PubMed
- Berger T, Larkum ME, Luscher HR (2001) High I(h) channel density in the distal apical dendrite of layer V pyramidal cells increases bidirectional attenuation of EPSPs. J Neurophysiol 85: 855-868. - PubMed
- Blatch GL, Lassle M (1999) The tetratricopeptide repeat: a structural motif mediating protein-protein interactions. BioEssays 21: 932-939. - PubMed
Publication types
MeSH terms
Substances
LinkOut - more resources
Full Text Sources
Molecular Biology Databases
Miscellaneous
