ABI2-deficient mice exhibit defective cell migration, aberrant dendritic spine morphogenesis, and deficits in learning and memory - PubMed (original) (raw)
Comparative Study
. 2004 Dec;24(24):10905-22.
doi: 10.1128/MCB.24.24.10905-10922.2004.
Galina Demyanenko, Asier Echarri, Patricia A Zipfel, Marisol E Quiroz, Ramona M Rodriguiz, Martin Playford, Shelby A Martensen, Matthew R Robinson, William C Wetsel, Patricia F Maness, Ann Marie Pendergast
Affiliations
- PMID: 15572692
- PMCID: PMC533973
- DOI: 10.1128/MCB.24.24.10905-10922.2004
Comparative Study
ABI2-deficient mice exhibit defective cell migration, aberrant dendritic spine morphogenesis, and deficits in learning and memory
Matthew Grove et al. Mol Cell Biol. 2004 Dec.
Abstract
The Abl-interactor (Abi) family of adaptor proteins has been linked to signaling pathways involving the Abl tyrosine kinases and the Rac GTPase. Abi proteins localize to sites of actin polymerization in protrusive membrane structures and regulate actin dynamics in vitro. Here we demonstrate that Abi2 modulates cell morphogenesis and migration in vivo. Homozygous deletion of murine abi2 produced abnormal phenotypes in the eye and brain, the tissues with the highest Abi2 expression. In the absence of Abi2, secondary lens fiber orientation and migration were defective in the eye, without detectable defects in proliferation, differentiation, or apoptosis. These phenotypes were consistent with the localization of Abi2 at adherens junctions in the developing lens and at nascent epithelial cell adherens junctions in vitro. Downregulation of Abi expression by RNA interference impaired adherens junction formation and correlated with downregulation of the Wave actin-nucleation promoting factor. Loss of Abi2 also resulted in cell migration defects in the neocortex and hippocampus, abnormal dendritic spine morphology and density, and severe deficits in short- and long-term memory. These findings support a role for Abi2 in the regulation of cytoskeletal dynamics at adherens junctions and dendritic spines, which is critical for intercellular connectivity, cell morphogenesis, and cognitive functions.
Figures
FIG. 1.
Generation of Abi2-deficient mice. (A) Targeted disruption of the abi2 locus. A BAC clone encoding the entire mouse abi2 gene was used to create a targeting construct in which the PGK-neo cassette replaced the genomic region encompassing exons 2 and 3 of abi2. Stop codons were introduced downstream of two Kozak sequences present in exon 5 to prevent the production of truncated Abi2 proteins. Ex, exon; H, HindIII; N1, EcoNI; Sp, SphI; S, SacI; X, XbaI. (B) Southern blot analysis of genomic DNA from wild-type (lanes 1 to 3, 6, 7 to 9, and 12) and Abi2 heterozygous (lanes 4, 5, 10, and 11) mice. Duplicate genomic DNA samples were digested with either SphI or EcoNI and probed with external or internal probes, respectively. An external probe was used to verify targeting, and an internal probe was used to verify the presence of stop codons introduced into exon 5. Bands of the expected size for the genomic locus (wt) and the targeted allele (null) were obtained. (C and D) Analysis of Abi1 and Abi2 protein levels in primary MEFs and brain from Abi2 wild-type (+/+), heterozygous (+/−), and null (−/−) mice. (C) Total protein (500 μg) was immunoprecipitated from primary MEFs (lanes 1 to 8) or P7 brain (lanes 9 to 12) with anti-Abi1 or anti-Abi2 sera (I) or their corresponding preimmune sera (P); the immunoprecipitates were blotted for Abi2 (top) and Abi1 (bottom). The protein band above 50 kDa is the immunoglobulin G heavy chain. (D) Total protein (20 μg) from P7 brain was analyzed by SDS-PAGE and Western blotting for anti-Abi2 (lanes 1 to 3) or anti-Abi1 (lanes 4 to 6). Blots were exposed for equivalent times. Molecular mass standards are shown.
FIG. 2.
Defective orientation and migration of secondary lens fibers in E16.5 Abi2 null lens. E16.5 eye sections (5 μm) were cut in the same plane as the optic nerve. In each panel's pair, magnification of wild-type (A1 to E1) and Abi2 null (A2 to E2) sections was the same, and the anterior of the eye in each section is at the top. (A) Whole eye. (B) Lens posterior regions (high magnification of sections in panel A): panel 1, the posterior suture of wild-type secondary lens fibers is to the left of the white line; panel 2, absent posterior suture in Abi2 null lens, to the left of the white line. SF, secondary lens fibers; PF, primary lens fibers. (C to E) Wild-type (C1 to E1) and Abi2 null (C2 to E2) lens sections were processed for immunohistochemistry and stained with anti-MIP26 (C), anti-γ crystallin (D), and anti-BrdU (E).
FIG. 3.
Abnormal lens phenotypes of postnatal Abi2 null mice. P1 sections of the eye were cut in the same plane as the optic nerve. In each pair, the magnification of wild-type (1) and Abi2 null (2) sections is the same, and the anterior region of each section is at the top. (A) Whole eye of wild-type (A1) and Abi2 null (A2) mice. (B1 and B2) Lens anterior and central region sections are higher magnifications of boxes b1 and b2 in panels A1 and A2, respectively. Note the presence of a V-shaped gap rather than a suture in the null lens (B2). (C1 and C2) Lens anterior and central region sections are higher magnifications of boxes c1 and c2 in panels A1 and A2, respectively. (D1 and D2) Lens equatorial region shown in a higher magnification of boxes d1 and d2 in panels A1 and A2, respectively. (E) Posterior of Abi2 null lens. Shown is a high magnification of boxed region e in panel A2, showing abnormally shaped primary lens fibers released from the broken posterior zone of the Abi2 null lens. AE, anterior epithelial cell layer; SF, secondary lens fibers; LC, lens capsule.
FIG. 4.
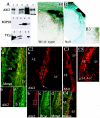
Localization of Abi2 in the lens during mouse development. (A) Pure lenses from P1 wild-type mice were fractionated. Fractions were separated by SDS-PAGE and blotted with anti-Abi2, anti-MIP26, or anti-γ crystallin (γCy) antibody, as indicated. Lane 1, 100 μg of hypotonic lysate; lane 2, 10 μg of hypotonic lysate; lane 3, 10 μg of CSK lysate; lane 4, 10 μg of RIPA lysate; lane 5, 1/20 of total RIPA-insoluble protein. (B) Wild-type (B1 and B3) and Abi2 null (B2) E18.5 lens sections were processed for immunohistochemistry and stained with anti-Abi2 antibody. Panel B3 shows a high magnification of the boxed region in panel B1. (C) Wild-type E16.5 lens sections were processed for indirect immunofluorescence by using the indicated antibodies, and _Z_-sections were examined by confocal microscopy. In panels C2a and C5, the dotted line delineates the EFI. (C1a) High-magnification merged image of anti-Abi2 (C1b) and anti-β-catenin (C1c) staining. (C2) The boxed regions in panels b, c, and d encompass the transition zone at the beginning of the EFI; panel a shows a higher magnification of the boxed regions in panels b, c, and d. The arrow denotes the beginning of the EFI. (C3 and C4) High magnification of the EFI stained with anti-Abi2 (C3) and costained with antibodies to Abi2 and β-catenin (C4). (C5) High magnification of _Z_-section of the EFI and anterior epithelial cell layer stained with antibodies to the p34 Arc component of the Arp2/3 complex. The dotted line delineates the EFI (C5). AE, anterior epithelial cell layer of the lens; SF, secondary lens fibers.
FIG. 5.
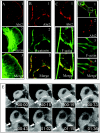
Localization of Abi2 to nascent adherens junctions in MDCK epithelial cells. MDCK cells in suspension in high-calcium medium were plated onto collagen IV-coated glass coverslips and allowed to migrate and form cell-cell junctions for 1 to 6 h. Cells were processed for indirect immunofluorescence by using the indicated antibodies or phalloidin to stain F-actin. (A) Migrating cell; panel A3 shows a merged image at high magnification of the lamellipodium stained for Abi2 (A1) and F-actin (A2). (B) Colocalization of Abi2 and β-catenin at cell-cell junctions. (C) Colocalization of Abi2 with F-actin at the cell-cell junction but not at the remainder of the cell periphery. (D) Junction formation between three cells. Panels D2 to D4 show higher magnification images of the cell-cell junction boxed in panel D1, stained for Abi2 and F-actin. (E) Time-lapse confocal microscopy of GFP-Abi2B-expressing MDCK epithelial cells. The arrow indicates the accumulation of GFP-Abi2B at adherens junctions. Time is indicated in the form hour:minute.
FIG. 6.
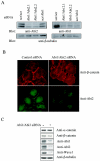
Downregulation of Abi expression impairs adherens junction formation in epithelial cells. (A) HeLa cells were transfected with a 100 nM concentration of the indicated siRNAs specific for Abi1 and/or Abi2 (Abi2.1 and -2.2), or with scrambled control siRNA. After 48 h, the cells were lysed and Abi protein levels were determined by Western blotting with the indicated anti-Abi antibodies. The blots were stripped and reprobed with β-tubulin antibody to show equal protein loading. (B) HeLa cells were cotransfected with 100 nM siRNA mix containing siRNAs for Abi1 and Abi2 or scrambled siRNA control (200 nM) as indicated. After 48 h, the cells were approximately 75% confluent and were fixed, permeabilized, and stained for β-catenin or for Abi2 as indicated. The results shown are representative of five independent experiments, with each transfection done in duplicate or triplicate. (C) HeLa cells transfected with scrambled or Abi1/Abi2 siRNAs were lysed at 48 h posttransfection, and the lysates were blotted for the indicated antibodies.
FIG. 7.
Localization of Abi2 in the developing mouse brain. (A and B) Coronal cryostat sections (20 μm thick) obtained from embryonic heads were processed for immunofluorescence (A) or immunohistochemistry (B) and incubated with the indicated antibodies (A1 to A3) or anti-Abi2 (B1 to B3). (A) E16.5 frontal cortical section. Shown is the region surrounding the anterior horn of the right lateral ventricle. S, superior part of ventricle. (B) E18.5 frontal cortical sections from wild-type (B1 and B3) and Abi2 null (B2) embryos stained for Abi2 (brown). (B3) High magnification of the marginal zone and cortical plate from panel B1, showing the presence of Abi2 in the cell body and horizontal process of Cajal Retzius-like cells (indicated by arrows) in the marginal zone. P, pia; M, marginal zone; C, cortical plate; I, intermediate zone; V, ventricular zone.
FIG. 8.
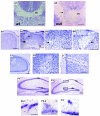
Morphological defects in the neocortex and hippocampus of Abi2 null mice. (A) Nissl-stained coronal sections (20 μm) of wild-type (A1) and Abi2 null (A2) neocortexes at E18.5 in the region of the corpus callosum (cc). In the wild-type mice (A1), the cells of the cortical plate form a distinct line above the corpus callosum, whereas these cells are displaced into the corpus callosum in Abi2 null mice (arrow). (B to F) Nissl-stained coronal sections (40 μm) of wild-type (B1 and F1) and Abi2 null (B2 to B4, C, D, F2 and F3) adult mouse brain from corresponding anatomical levels. (B) Comparison of wild-type (B1) and Abi2 null (B2-4) motor cortexes. Panels B3 and B4 are higher magnification images of B2. (B2 and B3) Invaginations of layer I (upper arrow). (B2 and B4) Misplacement of layer I within deeper layers of the cortex adjacent to the invagination (lower arrow). Note the aberrant, almost horizontal orientation of neurons towards the misplaced layer I. In panel B4, compare the cell orientation in the lower half to the right of the arrow with the orientation in the upper half. Py, pyramidal cell layer; Gr, granule cell layer; I, layer I of the neocortex; CC, corpus callosum. (C) Aberrant cellular orientation around cell-poor regions in the visual cortex of Abi2 null mice. Panel C2 is a higher magnification of the image in panel C1. (D) Invagination of layer I in the cingulate cortex of Abi2 null mice, with layer I to the left. (F) Comparison of wild-type (F1) and Abi2 null (F2 and F3) hippocampus sections. (F2-1 and F2-2) are higher magnifications of boxed regions 1 and 2, respetively, in panel F2. (F3) Higher-magnification image of the dentate gyrus of a different Abi2 null mouse. Bars = 100 μm.
FIG. 9.
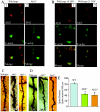
Loss of Abi2 results in aberrant spine morphology and density. (A and B) Primary neurons from P2 hippocampus were isolated from wild-type or Abi2−/− mice and cultured in vitro for either 14 (A and B1) or 21 (B2) days. Localization of Abi2 (red) at dendritic spines is visualized by intense costaining with F-actin (green). (A) Abi2 staining of dendritic spines from 14-DIV wild-type neurons (A1) but not Abi2 null hippocampal neurons (A2). Panels for wild-type and Abi2 null neurons were taken using identical confocal magnification and intensity settings. Note the intense dot of Abi2 staining at the center-front of the wild-type spine. (B) Abi2 staining of dendritic spines in wild-type hippocampal neurons grown for 14 DIV (B1) or 21 DIV (B2). (C to E) Analysis of dendritic spines in pyramidal neurons of adult wild-type, Abi2−/−, and Abi2+/− neocortexes and CA1 regions of the hippocampus by the Golgi impregnation procedure. Three to five mice of each genotype were employed for the analyses. (C) Representative images of basal dendrite branches of wild-type, Abi2−/−, and Abi2+/− pyramidal neurons of layer III of the somatosensory cortex. Arrows denote mushroom spines, and asterisks denotes stubby spines. (D) Representative images showing density of dendritic spines on side branches of apical dendrites for wild-type, Abi2−/−, and Abi2+/− CA1 hippocampal pyramidal neurons. (E) Quantification of spine density from panel D expressed as the mean number of spines per 100 μm of dendritic length.
FIG. 10.
Defective memory formation in Abi2-deficient mice. (A) Sensitivity of wild-type, Abi2+/−, and Abi2−/− mice to scrambled foot shock; each genotype behaved in a similar manner. (B and C) Passive avoidance testing: shown is the latency (in seconds) to enter the darkened chamber from the lighted chamber during training and at 30 or 60 min or 24 h after training; n = 7 to 10 mice for each genotype. (B) During initial testing, all naive mice rapidly crossed to the dark chamber. However, at 30 or 60 min or 24 h after training, wild-type mice did not readily cross to the dark chamber, while Abi2+/− and Abi2−/− mice readily crossed. *, P < 0.05 versus wild-type controls. (C) Since Abi2+/− and Abi2−/− mice showed poor retention in initial testing, animals that were initially tested for a 1-h retention were retrained and retested at that same (1-h) retention interval 1 week later. Note that there was still a tendency (*, P < 0.06) for Abi2−/− mice to enter the dark chamber more readily than wild-type animals. (D) Individual recordings depicting crossing and duration of time spent (maximal time allowed = 300 s) in the lighted (grey bars) and dark (black bars) chambers by wild-type (n = 8), Abi2+/− (n = 7), and Abi2−/− (n = 8) mice during the 1-h retention test following retraining and retesting for passive avoidance.
Similar articles
- Ankyrin-G regulated epithelial phenotype is required for mouse lens morphogenesis and growth.
Rasiah PK, Maddala R, Bennett V, Rao PV. Rasiah PK, et al. Dev Biol. 2019 Feb 1;446(1):119-131. doi: 10.1016/j.ydbio.2018.12.016. Epub 2018 Dec 15. Dev Biol. 2019. PMID: 30562487 Free PMC article. - Rac1 GTPase-deficient mouse lens exhibits defects in shape, suture formation, fiber cell migration and survival.
Maddala R, Chauhan BK, Walker C, Zheng Y, Robinson ML, Lang RA, Rao PV. Maddala R, et al. Dev Biol. 2011 Dec 1;360(1):30-43. doi: 10.1016/j.ydbio.2011.09.004. Epub 2011 Sep 16. Dev Biol. 2011. PMID: 21945075 Free PMC article. - Differential requirement for beta-catenin in epithelial and fiber cells during lens development.
Cain S, Martinez G, Kokkinos MI, Turner K, Richardson RJ, Abud HE, Huelsken J, Robinson ML, de Iongh RU. Cain S, et al. Dev Biol. 2008 Sep 15;321(2):420-33. doi: 10.1016/j.ydbio.2008.07.002. Epub 2008 Jul 9. Dev Biol. 2008. PMID: 18652817 - The cellular function of srGAP3 and its role in neuronal morphogenesis.
Bacon C, Endris V, Rappold GA. Bacon C, et al. Mech Dev. 2013 Jun-Aug;130(6-8):391-5. doi: 10.1016/j.mod.2012.10.005. Epub 2012 Nov 2. Mech Dev. 2013. PMID: 23127797 Review. - The Role of Rac GTPase in Dendritic Spine Morphogenesis and Memory.
Costa JF, Dines M, Lamprecht R. Costa JF, et al. Front Synaptic Neurosci. 2020 Apr 17;12:12. doi: 10.3389/fnsyn.2020.00012. eCollection 2020. Front Synaptic Neurosci. 2020. PMID: 32362820 Free PMC article. Review.
Cited by
- A novel spontaneous mutation of BCAR3 results in extrusion cataracts in CF#1 mouse strain.
Kondo T, Nakamori T, Nagai H, Takeshita A, Kusakabe KT, Okada T. Kondo T, et al. Mamm Genome. 2016 Oct;27(9-10):451-9. doi: 10.1007/s00335-016-9653-8. Epub 2016 Jun 30. Mamm Genome. 2016. PMID: 27364350 - The WAVE2 complex regulates actin cytoskeletal reorganization and CRAC-mediated calcium entry during T cell activation.
Nolz JC, Gomez TS, Zhu P, Li S, Medeiros RB, Shimizu Y, Burkhardt JK, Freedman BD, Billadeau DD. Nolz JC, et al. Curr Biol. 2006 Jan 10;16(1):24-34. doi: 10.1016/j.cub.2005.11.036. Curr Biol. 2006. PMID: 16401421 Free PMC article. - Role of Thyroid Hormone in Neurodegenerative Disorders of Older People.
Mooradian AD, Haas MJ. Mooradian AD, et al. Cells. 2025 Jan 18;14(2):140. doi: 10.3390/cells14020140. Cells. 2025. PMID: 39851568 Free PMC article. Review. - Abl tyrosine kinases regulate cell-cell adhesion through Rho GTPases.
Zandy NL, Playford M, Pendergast AM. Zandy NL, et al. Proc Natl Acad Sci U S A. 2007 Nov 6;104(45):17686-91. doi: 10.1073/pnas.0703077104. Epub 2007 Oct 26. Proc Natl Acad Sci U S A. 2007. PMID: 17965237 Free PMC article. - An autism-linked missense mutation in SHANK3 reveals the modularity of Shank3 function.
Wang L, Pang K, Han K, Adamski CJ, Wang W, He L, Lai JK, Bondar VV, Duman JG, Richman R, Tolias KF, Barth P, Palzkill T, Liu Z, Holder JL Jr, Zoghbi HY. Wang L, et al. Mol Psychiatry. 2020 Oct;25(10):2534-2555. doi: 10.1038/s41380-018-0324-x. Epub 2019 Jan 4. Mol Psychiatry. 2020. PMID: 30610205 Free PMC article.
References
- Abe, K., O. Chisaka, F. van Roy, and M. Takeichi. 2004. Stability of dendritic spines and synaptic contacts is controlled by βN-catenin. Nat. Neurosci. 7:357-363. - PubMed
- Bassnett, S., H. Missey, and I. Vucemilo. 1999. Molecular architecture of the lens fiber cell basal membrane complex. J. Cell Sci. 112:2155-2165. - PubMed
- Biesova, Z., C. Piccoli, and W. T. Wong. 1997. Isolation and characterization of e3B1, an eps8 binding protein that regulates cell growth. Oncogene 14:233-241. - PubMed
- Blagg, S. L., M. Stewart, C. Sambles, and R. H. Insall. 2003. PIR121 regulates pseudopod dynamics and SCAR activity in Dictyostelium. Curr. Biol. 13:1480-1487. - PubMed
- Chelly, J., and J. L. Mandel. 2001. Monogenic causes of X-linked mental retardation. Nat. Rev. Genetics 2:669-680. - PubMed
Publication types
MeSH terms
Substances
Grants and funding
- GM 62375/GM/NIGMS NIH HHS/United States
- R01 GM062375/GM/NIGMS NIH HHS/United States
- R01 CA 70940/CA/NCI NIH HHS/United States
- R01 HD 35170/HD/NICHD NIH HHS/United States
- R01 NS026620/NS/NINDS NIH HHS/United States
- NS 26620/NS/NINDS NIH HHS/United States
- R01 CA070940/CA/NCI NIH HHS/United States
LinkOut - more resources
Full Text Sources
Medical
Molecular Biology Databases
Miscellaneous


