Single-channel behavior of heteromeric alpha1beta glycine receptors: an attempt to detect a conformational change before the channel opens - PubMed (original) (raw)
Single-channel behavior of heteromeric alpha1beta glycine receptors: an attempt to detect a conformational change before the channel opens
Valeria Burzomato et al. J Neurosci. 2004.
Abstract
The alpha1beta heteromeric receptors are likely to be the predominant synaptic form of glycine receptors in the adult. Their activation mechanism was investigated by fitting putative mechanisms to single-channel recordings obtained at four glycine concentrations (10-1000 microm) from rat alpha1beta receptors, expressed in human embryonic kidney 293 cells. The adequacy of each mechanism, with its fitted rate constants, was assessed by comparing experimental dwell time distributions, open-shut correlations, and the concentration-open probability (P(open)) curve with the predictions of the model. A good description was obtained only if the mechanism had three glycine binding sites, allowed both partially and fully liganded openings, and predicted the presence of open-shut correlations. A strong feature of the data was the appearance of an increase in binding affinity as more glycine molecules bind, before the channel opens. One interpretation of this positive binding cooperativity is that binding sites interact, each site sensing the state of ligation of the others. An alternative, and novel, explanation is that agonist binding stabilizes a higher affinity form of the receptor that is produced by a conformational change ("flip") that is separate from, and precedes, channel opening. Both the "interaction" scheme and the flip scheme describe our data well, but the latter has fewer free parameters and above all it offers a mechanism for the affinity increase. Distinguishing between the two mechanisms will be important for our understanding of the structural dynamics of activation in the nicotinic superfamily and is important for our understanding of mutations in these receptors.
Figures
Figure 4.
Fitting of a scheme with three identical binding sites (scheme 1) to α1β glycine channel activations (8 free parameters). A, Scheme 1 was fitted with constraints (Eq. 5) that ensured that the association and dissociation rate constants were the same for each binding step (identical binding sites). For clarity, this is indicated in the figure by the same dissociation constants (K) displayed over the binding steps. B, Comparison of the predictions of the fit with the experimental data. The mechanism was fitted simultaneously to three sets of data at four different glycine concentrations; one of the three sets is shown in this and the other figures. The first two rows of plots show the apparent open and shut times distributions. The histograms are the experimental distributions (note that only shut times below _t_crit are fitted; see Materials and Methods). The solid lines are predicted (HJC) distributions calculated from the mechanism, the resolution, and the values of the rate constants that were found to maximize the likelihood of the experimental sequences of single-channel openings and shuttings. These distributions allow for missed events on the basis of the imposed resolution, whereas the dashed lines are the distributions expected if no events were missed. In the third row the mean duration of openings that are adjacent to shut times in a specified range of duration is plotted against the mean duration of the shut times in each chosen range. These plots illustrate the correlation between the duration of adjacent open and shut times. Experimental points are shown as filled circles (±SDM) joined by a solid line, predicted points as open circles, and the theoretical continuous relationship between open time and adjacent shut time as a dashed line. C, Experimental _P_open values (not corrected for missed brief shuttings) are plotted as filled circles against the glycine concentration. The solid line is the apparent _P_open- concentration curve predicted by the fitted scheme and rate constants taking into account the effect of missed events (from Eqs. 2-4). The dashed line is the ideal curve expected if no events were missed. In this case, the predictions of the fitted mechanism and rates are quite poor, so this scheme is unlikely to be the real activation mechanism of the channel.
Figure 1.
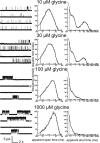
Activation of heteromeric α1β channels by increasing concentrations of glycine. The left column shows continuous sweeps of cell-attached recordings at 10, 30, 100, and 1000 μ
m
glycine (3 kHz filter). Bursts of openings are observed at 10 μ
m
, whereas at higher agonist concentrations bursts group into clusters. The middle and right columns show the dwell-time distributions (apparent open and shut times) corresponding to the same patches for which traces are shown to the left. Distributions were fitted with a mixture of exponential probability density functions (Table 1).
Figure 2.
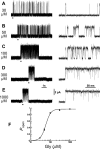
Concentration dependence of the open probability of clusters of α1β channel openings. A-E, Representative clusters elicited by 30, 50, 100, 300, and 1000 μ
m
glycine. The bars under the traces on the left indicate the regions shown on the right on an expanded time scale. F, The _P_open concentration-response curve to glycine. The curve shows an empirical fit of the Hill equation (weighted least squares). The observed points in this plot (unlike later plots) have been corrected approximately for missed short shuttings (see Results). _P_open values are obtained for each patch from the ratio between the total open time (obtained from records idealized by time-course fitting) and the total duration of the clusters. The points are averages of three to four patches (17-91 clusters) (Table 2) for each glycine concentration.
Figure 5.
Test of the possibility that agonist binding sites are initially different: a scheme with two types of binding sites (scheme 2, 14 free parameters; constraints as in Eq. 6). A, Scheme 2 incorporates two types of binding sites, termed a and b, corresponding to the αα site and the two αβ sites, respectively. Binding rate constants at each site are postulated not to be affected by occupancy of other sites, and therefore the αα site has a constant affinity of 1/_K_a and each αβ site a constant affinity of 1/_K_b. B, Comparison of observed and predicted dwell-time distributions and open-shut time correlations, as in Figure 4. _C, P_open- concentration data and the concentration-response curve predicted from the mechanism fit, as in Figure 4. The obvious discrepancies between experimental observations and model predictions in B (especially at the higher concentrations) and C indicate that scheme 2 fails to describe the data.
Figure 6.
Test of a mechanism in which the affinity of the binding sites appears to be affected by the level of occupancy: a scheme with three binding sites and no constrained parameters (12 free parameters). A, All rate constants in scheme 1 were estimated as free parameters. B, Comparison of observed and predicted dwell-time distributions and open-shut time correlations, as in Figure 4. _C, P_open- concentration data and the concentration-response curve predicted from the mechanism fit. Comparing this fit with that of Figure 4 shows an improvement that is consistent across all forms of data display. Nevertheless, the fit is still inadequate for data at 1000 μ
m
and for the fast component of the shut-time distribution at 10 μ
m
.
Figure 7.
Test of a mechanism with three additional shut states and no constrained parameters (18 free parameters). A, Scheme 3, showing the additional shut states as D. Access to D states is not concentration dependent. B and C are as in Figure 4. Note that the predictions of this model are much closer to the observed dwell-time distributions and open-shut correlations than those of scheme 1 with no constraints (Fig. 6).
Figure 8.
The flip mechanism: three additional shut states resulting from a pre-opening conformational change (scheme 5, 14 free parameters, constraints as in Eq. 7). A, Scheme 5 has three equivalent binding sites. Each of the bound resting states R can switch to a flip conformation F, in which the pore is still shut, but binding affinity (for all sites) is higher than for R states. From the F states the protein can open (F*). The scheme was fitted with the constraint that all binding steps in the set of R or F states have equal rate constants (and therefore the same equilibrium dissociation constant, _K_R and _K_F, for R and F states, respectively). This constraint (on the rate constants) is indicated in the figure by displaying the same dissociation constants on the binding steps. B and C are as in Figure 4. This mechanism describes the data very well with 14 free parameters. The quality of the predictions is indistinguishable from the fits with the model shown in Figure 7 (three binding sites, three additional shut states, no constraints, 18 free parameters).
Figure 10.
Test of the flip mechanism on data from homomeric α1 glycine receptors. A, Scheme 5, with binding rates constrained to be equal within resting states (R) and flip states (F), as in Figure 8. B and C are as in Figure 4; data from Beato et al. (2004). Scheme 5 provides an excellent prediction of single-channel behavior for α1 homomeric glycine receptors. The agreement of scheme 5 with the data is of a quality comparable with that observed for the best-fitting models in Beato et al. (2004), which were scheme 1 with no constraints or an extended scheme 1, with five binding sites and saturation of gating.
Figure 12.
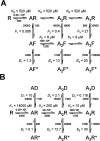
A comparison of the flip mechanism (scheme 5) (A) with scheme 3 (B). The averaged rate constants (units as in Tables 4 and 5) and equilibrium constants are shown. Both mechanisms gave good fits with these values (Figs. 7, 8).
Figure 3.
Some of the kinetic schemes tested for α1β glycine channels. Agonist molecules are indicated by A, resting states of the receptor by R, and open states by an asterisk. Note that in scheme 2, the receptor is represented by Ra - Rb to indicate that it contains two different types of binding sites (a and b). In schemes 3-5, shut states of the receptor are denoted R, D (desensitized), and F (flipped, i.e., in the pre-opening conformation; see Results). Open channels are indicated by an asterisk (R* or F*). The names of the rate constants for the different steps of the reactions are shown, and the statistical factors in the binding rate constants have been included. These are needed to get the actual transition rates in the Q matrix, taking into account the number of sites available for each binding step.
Figure 9.
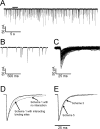
The decay of spontaneous glycinergic IPSCs in rat spinal motoneurons in vitro is well accounted for by activation mechanisms that describe single-channel behavior. A, Spontaneous glycine-mediated synaptic current in a P18 rat motoneuron held at -70 mV; the bar shows portion of the trace shown at an expanded time scale in B. C, IPSCs aligned by their peak. D, E, Comparison of the observed IPSC decay with the response to a 1 ms pulse of 1 m
m
glycine, calculated from the results of fitting schemes 1, 3, or 5 to the single-channel data. Note that the mechanisms that best describe IPSC time course are the same schemes that best fit single-channel results: namely, schemes 3 and 5.
Figure 11.
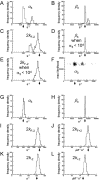
Results of repeated fits to simulated data sets. Results were simulated with the flip mechanism (scheme 5), a resolution of 30 μs was imposed, and “data” for 10, 30, 100, and 1000 μ
m
were fitted simultaneously with the same mechanism (14 free rate constants). The first six graphs (A-F) are from 257 fits that started from bad guesses (Table 7, guess 1). The last six graphs (G-L) are from 576 fits that started from better guesses (Table 7, guess 2). All graphs apart from F show the distributions of the estimates of a rate constant that were obtained in each fit. The arrows show the true value of that rate constant. In F, the maximum likelihood found in each fit is plotted against the value of α3 found in the same fit: the two clusters of points correspond to the two peaks in A.
Similar articles
- The activation mechanism of alpha1 homomeric glycine receptors.
Beato M, Groot-Kormelink PJ, Colquhoun D, Sivilotti LG. Beato M, et al. J Neurosci. 2004 Jan 28;24(4):895-906. doi: 10.1523/JNEUROSCI.4420-03.2004. J Neurosci. 2004. PMID: 14749434 Free PMC article. - The long activations of α2 glycine channels can be described by a mechanism with reaction intermediates ("flip").
Krashia P, Lape R, Lodesani F, Colquhoun D, Sivilotti LG. Krashia P, et al. J Gen Physiol. 2011 Feb;137(2):197-216. doi: 10.1085/jgp.201010521. J Gen Physiol. 2011. PMID: 21282399 Free PMC article. - Openings of the rat recombinant alpha 1 homomeric glycine receptor as a function of the number of agonist molecules bound.
Beato M, Groot-Kormelink PJ, Colquhoun D, Sivilotti LG. Beato M, et al. J Gen Physiol. 2002 May;119(5):443-66. doi: 10.1085/jgp.20028530. J Gen Physiol. 2002. PMID: 11981023 Free PMC article. - What single-channel analysis tells us of the activation mechanism of ligand-gated channels: the case of the glycine receptor.
Sivilotti LG. Sivilotti LG. J Physiol. 2010 Jan 1;588(Pt 1):45-58. doi: 10.1113/jphysiol.2009.178525. Epub 2009 Sep 21. J Physiol. 2010. PMID: 19770192 Free PMC article. Review. - Function and structure in glycine receptors and some of their relatives.
Colquhoun D, Sivilotti LG. Colquhoun D, et al. Trends Neurosci. 2004 Jun;27(6):337-44. doi: 10.1016/j.tins.2004.04.010. Trends Neurosci. 2004. PMID: 15165738 Review.
Cited by
- Perspectives on: conformational coupling in ion channels.
Andersen OS. Andersen OS. J Gen Physiol. 2012 Dec;140(6):595-7. doi: 10.1085/jgp.201210926. J Gen Physiol. 2012. PMID: 23183695 Free PMC article. No abstract available. - Bayesian Statistical Inference in Ion-Channel Models with Exact Missed Event Correction.
Epstein M, Calderhead B, Girolami MA, Sivilotti LG. Epstein M, et al. Biophys J. 2016 Jul 26;111(2):333-348. doi: 10.1016/j.bpj.2016.04.053. Biophys J. 2016. PMID: 27463136 Free PMC article. - How subunits cooperate in cAMP-induced activation of homotetrameric HCN2 channels.
Kusch J, Thon S, Schulz E, Biskup C, Nache V, Zimmer T, Seifert R, Schwede F, Benndorf K. Kusch J, et al. Nat Chem Biol. 2011 Dec 18;8(2):162-9. doi: 10.1038/nchembio.747. Nat Chem Biol. 2011. PMID: 22179066 - Modes and models of GABA(A) receptor gating.
Lema GM, Auerbach A. Lema GM, et al. J Physiol. 2006 Apr 1;572(Pt 1):183-200. doi: 10.1113/jphysiol.2005.099093. Epub 2006 Feb 2. J Physiol. 2006. PMID: 16455693 Free PMC article. - From shut to open: what can we learn from linear free energy relationships?
Colquhoun D. Colquhoun D. Biophys J. 2005 Dec;89(6):3673-5. doi: 10.1529/biophysj.105.071563. Biophys J. 2005. PMID: 16319077 Free PMC article. No abstract available.
References
- Ball FG, Davies SS, Sansom MS (1990) Single-channel data and missed events: analysis of a two-state Markov model. Proc R Soc Lond B Biol Sci 242: 61-67. - PubMed
- Ball FG, Davies SS, Sansom MS (1994) Ion channel gating and time interval omission: statistical inference for a two-state Markov model. Proc R Soc Lond B Biol Sci 255: 267-272. - PubMed
Publication types
MeSH terms
Substances
LinkOut - more resources
Full Text Sources
Molecular Biology Databases

