Differential inhibition of macrophage foam-cell formation and atherosclerosis in mice by PPARalpha, beta/delta, and gamma - PubMed (original) (raw)
. 2004 Dec;114(11):1564-76.
doi: 10.1172/JCI18730.
Christoph J Binder, Alejandra Gutierrez, Kathleen K Brown, Christine R Plotkin, Jennifer W Pattison, Annabel F Valledor, Roger A Davis, Timothy M Willson, Joseph L Witztum, Wulf Palinski, Christopher K Glass
Affiliations
- PMID: 15578089
- PMCID: PMC529277
- DOI: 10.1172/JCI18730
Differential inhibition of macrophage foam-cell formation and atherosclerosis in mice by PPARalpha, beta/delta, and gamma
Andrew C Li et al. J Clin Invest. 2004 Dec.
Abstract
PPARalpha, beta/delta, and gamma regulate genes involved in the control of lipid metabolism and inflammation and are expressed in all major cell types of atherosclerotic lesions. In vitro studies have suggested that PPARs exert antiatherogenic effects by inhibiting the expression of proinflammatory genes and enhancing cholesterol efflux via activation of the liver X receptor-ABCA1 (LXR-ABCA1) pathway. To investigate the potential importance of these activities in vivo, we performed a systematic analysis of the effects of PPARalpha, beta, and gamma agonists on foam-cell formation and atherosclerosis in male LDL receptor-deficient (LDLR(-/-)) mice. Like the PPARgamma agonist, a PPARalpha-specific agonist strongly inhibited atherosclerosis, whereas a PPARbeta-specific agonist failed to inhibit lesion formation. In concert with their effects on atherosclerosis, PPARalpha and PPARgamma agonists, but not the PPARbeta agonist, inhibited the formation of macrophage foam cells in the peritoneal cavity. Unexpectedly, PPARalpha and PPARgamma agonists inhibited foam-cell formation in vivo through distinct ABCA1-independent pathways. While inhibition of foam-cell formation by PPARalpha required LXRs, activation of PPARgamma reduced cholesterol esterification, induced expression of ABCG1, and stimulated HDL-dependent cholesterol efflux in an LXR-independent manner. In concert, these findings reveal receptor-specific mechanisms by which PPARs influence macrophage cholesterol homeostasis. In the future, these mechanisms may be exploited pharmacologically to inhibit the development of atherosclerosis.
Figures
Figure 1
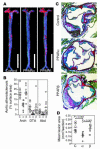
Atherosclerosis in LDLR–/– male mice that were fed the HC diet for 14 weeks. (A) Sudan IV-_stained en face preparations of aortas. Scale bars: 1 cm. (B) Quantitative analysis of atherosclerotic surface area in the entire aorta. (C) Sections through the aortic root at the level of the aortic valves. The micrographs are taken of sections at a similar distance from the aortic root. Original magnification, ×4. (D) Quantitative analysis of lesion areas in the aortic root. Data expressed as the mean ± SEM. C, control; α, PPARα agonist GW7647; β, PPARβ agonist GW0742; Abd, abdominal aorta; Arch, aortic arch. *P < 0.001 and **P _ 0.02, compared with control.
Figure 2
Metabolic effects of PPAR ligands. Weight (A), plasma insulin levels (B), and size distribution (C) of lipoprotein particles fractionated by FPLC. Measurements of weight and plasma insulin levels were taken at the indicated time points. FPLC analysis of lipoproteins was done using pooled plasma from terminal bleeds. Circles, control; diamonds, PPARα agonist GW7647; squares, PPARβ agonist GW0742. Data are expressed as mean ± SEM. *P _ 0.05 compared with control. Measurements are from individual animals shown in Figure 1. Control, n = 8; PPARα agonist, n = 9; PPARβ agonist, n = 10.
Figure 3
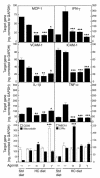
Gene expression in atherosclerotic lesions determined by real-time PCR analysis. Animals were fed an HC diet for 3 months (resulting in advanced lesions), followed by 4 weeks on the same diet supplemented with the indicated PPAR agonists. Data are expressed as the mean ± SEM of triplicate measurements and are representative of 2 independent experiments. In each case, *P _ 0.05, **P _ 0.01, and ***P _ 0.001, compared with HC. Std, standard.
Figure 4
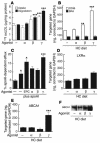
Determination of scavenger receptor activity and cholesterol efflux in cultured peritoneal macrophages. PPAR-specific agonists, as indicated. (A) Influence of PPAR agonists on uptake (white bars) and degradation (black bars) of oxLDL. (B) Influence of PPAR agonists on CD36 and SRA expression by real-time PCR in hypercholesterolemic macrophages. (C) Influence of LXR and PPAR agonists on apoAI and HDL-specific cholesterol efflux in acLDL-loaded peritoneal macrophages. Expression of LXRα (D) and ABCA1 (E) by real-time PCR in hypercholesterolemic macrophages treated with PPAR agonists in vitro. (F) Western blot analysis of ABCA1 protein in hypercholesterolemic macrophages treated with PPAR agonists as in E. Data are mean ± SEM and are representative of at least 2 independent experiments. In each case, *P _ 0.05, **P _ 0.01, and ***P < 0.001 compared with control. EPC, 24 (S), -25-epoxycholesterol; 125I oxLDL, 125I-labeled oxLDL.
Figure 5
Effects of PPAR-specific ligands on macrophage foam-cell formation in vivo. LDLR–/– mice were fed a control or HC diet for 4 months and were treated for the last month with PPAR-specific agonists, as indicated. Mice were injected intraperitoneally with thioglycollate after the fourth week of drug treatment and peritoneal macrophages were harvested 4 days later for analysis. (A) Oil red O staining. Original magnification, ×40. (B) Quantification of triglycerides and cholesterol. For cholesterol values, total bar height represents total cholesterol. The free cholesterol component is represented by a black bar and esterified cholesterol, calculated as total cholesterol minus free cholesterol, is represented by a white bar. Data are expressed as micrograms per milligram of cell protein and are representative of 2 independent experiments. (C) Expression of PPARα, β, and γ in normal (white bars) and hypercholesterolemic (black bars) macrophages. Liver is included as a positive control for a tissue expressing relatively high levels of PPARα. (D) Expression of CD36 mRNA levels determined by real-time PCR. (E) Expression of ABCA1 and LXRα mRNA levels determined by real-time PCR and Western analysis. Real-time PCR data expressed are mean ± SEM. The results are representative of 2 independent experiments. *P _ 0.05 versus control, ***P < 0.001 versus HC control.
Figure 6
Effects of the PPARα agonist on foam-cell formation are intrinsic to the macrophage. Transfer of thioglycollate-elicited PPARα wild-type and PPARα–/– peritoneal macrophages. Elicited macrophages were isolated from wild-type C57BL/6J (C57BL WT), 129SU/SvImJ (129S WT), or PPARα–/– 129SU/SvImJ (129S PPARα–/–) mice. We injected 3 × 10⁷ cells of each genotype into the peritoneal cavities of hypercholesterolemic LDLR–/– mice. Cells were recovered from the peritoneal cavity for analysis by Oil red O staining (A). No tx, no treatment. Original magnification, ×40. (B) Measurement of triglyceride and cholesterol content as in Figure 5. (C) Western blotting of ABCA1 protein. The results are representative of at least 2 independent experiments.
Figure 7
PPARα, but not PPARγ, agonists require LXR to reduce foam-cell formation in peritoneal macrophages. (A) Transfer of thioglycollate-elicited wild-type and LXR DKO peritoneal macrophages into hypercholesterolemic LDLR–/– mice treated with rosiglitazone (rosi) or control solvent (No tx) for 4 weeks. Macrophages were stained with Oil red O. Original magnification, ×40. (B) Quantification of triglycerides and cholesterol in transferred macrophages as described in Figure 5. (C) Western blot analysis of ABCA1 protein levels in transferred peritoneal macrophages. (D) Real-time PCR analysis of LXRα and LXRβ expression in peritoneal macrophages derived from irradiated LDL-R–/– mice reconstituted with bone marrow derived from either wild-type or LXR DKO mice. (E) Oil red O staining of peritoneal macrophages isolated from hypercholesterolemic LDLR–/– mice reconstituted with LXR DKO bone marrow under the following treatment conditions: no treatment, PPARα agonist, or PPARγ agonist. Original magnification, ×40.
Figure 8
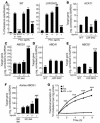
PPARγ inhibits cholesterol esterification and stimulates ABCG1 expression in an LXR-independent manner. (A) The PPARγ agonist rosiglitazone inhibited cholesterol esterification in both wild-type and LXR DKO macrophages subjected to cholesterol loading with agLDL. The results are representative of at least 2 independent experiments. (B) Real-time PCR analysis of ACAT1 mRNA expression in wild-type and LXR DKO macrophages. (C) Rosiglitazone induced ABCG1 expression in macrophages isolated from hypercholesterolemic LDLR–/– mice. Rosiglitazone had no effect on ABCA1 expression (D) but induced ABCG1 expression in LXR DKO macrophages isolated from LDLR–/– mice (E). (F) Rosiglitazone induced ABCG1 expression in aortas of hypercholesterolemic LDLR–/– mice containing extensive lesions. (G) Rosiglitazone induced HDL-specific cholesterol efflux in macro-phages. Data are expressed as mean ± SEM. **P _ 0.01 and ***P < 0.001, compared with the no-treatment control.
Comment in
- PPARs in atherosclerosis: the clot thickens.
Castrillo A, Tontonoz P. Castrillo A, et al. J Clin Invest. 2004 Dec;114(11):1538-40. doi: 10.1172/JCI23705. J Clin Invest. 2004. PMID: 15578084 Free PMC article.
Similar articles
- Oxidative stress influences cholesterol efflux in THP-1 macrophages: role of ATP-binding cassette A1 and nuclear factors.
Marcil V, Delvin E, Sané AT, Tremblay A, Levy E. Marcil V, et al. Cardiovasc Res. 2006 Dec 1;72(3):473-82. doi: 10.1016/j.cardiores.2006.08.024. Epub 2006 Sep 14. Cardiovasc Res. 2006. PMID: 17070507 - Lysophosphatidylcholine promotes cholesterol efflux from mouse macrophage foam cells via PPARgamma-LXRalpha-ABCA1-dependent pathway associated with apoE.
Hou M, Xia M, Zhu H, Wang Q, Li Y, Xiao Y, Zhao T, Tang Z, Ma J, Ling W. Hou M, et al. Cell Biochem Funct. 2007 Jan-Feb;25(1):33-44. doi: 10.1002/cbf.1374. Cell Biochem Funct. 2007. PMID: 16981222 - Functional Regulation of PPARs through Post-Translational Modifications.
Brunmeir R, Xu F. Brunmeir R, et al. Int J Mol Sci. 2018 Jun 12;19(6):1738. doi: 10.3390/ijms19061738. Int J Mol Sci. 2018. PMID: 29895749 Free PMC article. Review. - The Endocannabinoid System and PPARs: Focus on Their Signalling Crosstalk, Action and Transcriptional Regulation.
Iannotti FA, Vitale RM. Iannotti FA, et al. Cells. 2021 Mar 7;10(3):586. doi: 10.3390/cells10030586. Cells. 2021. PMID: 33799988 Free PMC article. Review.
Cited by
- Bone marrow NR4A expression is not a dominant factor in the development of atherosclerosis or macrophage polarization in mice.
Chao LC, Soto E, Hong C, Ito A, Pei L, Chawla A, Conneely OM, Tangirala RK, Evans RM, Tontonoz P. Chao LC, et al. J Lipid Res. 2013 Mar;54(3):806-815. doi: 10.1194/jlr.M034157. Epub 2013 Jan 3. J Lipid Res. 2013. PMID: 23288947 Free PMC article. - Foam Cells as Therapeutic Targets in Atherosclerosis with a Focus on the Regulatory Roles of Non-Coding RNAs.
Javadifar A, Rastgoo S, Banach M, Jamialahmadi T, Johnston TP, Sahebkar A. Javadifar A, et al. Int J Mol Sci. 2021 Mar 3;22(5):2529. doi: 10.3390/ijms22052529. Int J Mol Sci. 2021. PMID: 33802600 Free PMC article. Review. - Activation of PPAR-δ induces microRNA-100 and decreases the uptake of very low-density lipoprotein in endothelial cells.
Fang X, Fang L, Liu A, Wang X, Zhao B, Wang N. Fang X, et al. Br J Pharmacol. 2015 Aug;172(15):3728-36. doi: 10.1111/bph.13160. Epub 2015 Jun 26. Br J Pharmacol. 2015. PMID: 25857370 Free PMC article. - The role of peroxisome proliferator-activated receptors (PPAR) in immune responses.
Christofides A, Konstantinidou E, Jani C, Boussiotis VA. Christofides A, et al. Metabolism. 2021 Jan;114:154338. doi: 10.1016/j.metabol.2020.154338. Epub 2020 Aug 11. Metabolism. 2021. PMID: 32791172 Free PMC article. Review. - RAGE Suppresses ABCG1-Mediated Macrophage Cholesterol Efflux in Diabetes.
Daffu G, Shen X, Senatus L, Thiagarajan D, Abedini A, Hurtado Del Pozo C, Rosario R, Song F, Friedman RA, Ramasamy R, Schmidt AM. Daffu G, et al. Diabetes. 2015 Dec;64(12):4046-60. doi: 10.2337/db15-0575. Epub 2015 Aug 7. Diabetes. 2015. PMID: 26253613 Free PMC article.
References
- Issemann I, Prince RA, Tugwood JD, Green S. The peroxisome proliferator-activated receptor: retinoid X receptor heterodimer is activated by fatty acids and fibrate hypolipidaemic drugs. J. Mol. Endocrinol. 1993;11:37–47. - PubMed
- Willson T, Brown P, Sternbach D, Henke B. The PPARs: From orphan receptors to drug discovery. J. Med. Chem. 2000;43:527–550. - PubMed
- Chawla A, Repa J, Evans R, Mangelsdorf D. Nuclear receptors and lipid physiology: Opening the X-files. Science. 2001;294:1866–1870. - PubMed
- Barbier O, et al. Pleiotropic actions of peroxisome proliferator-activated receptors in lipid metabolism and atherosclerosis. Arterioscler. Thromb. Vasc. Biol. 2002;22:717–726. - PubMed
- Bardot O, Aldridge TC, Latruffe N, Green S. PPAR-RXR heterodimer activates a peroxisome proliferator response element upstream of the bifunctional enzyme gene. Biochem. Biophys. Res. Commun. 1993;192:37–45. - PubMed
Publication types
MeSH terms
Substances
LinkOut - more resources
Full Text Sources
Other Literature Sources
Molecular Biology Databases


