Arabidopsis FHY3/FAR1 gene family and distinct roles of its members in light control of Arabidopsis development - PubMed (original) (raw)
Arabidopsis FHY3/FAR1 gene family and distinct roles of its members in light control of Arabidopsis development
Rongcheng Lin et al. Plant Physiol. 2004 Dec.
Abstract
FHY3 (far-red elongated hypocotyls 3) and FAR1 (far-red-impaired response) are two homologous proteins essential for phytochrome A controlled far-red responses in Arabidopsis (Arabidopsis thaliana). There are 12 additional FHY3/FAR1-related genes in the Arabidopsis genome. The predicted sizes of this family of proteins range from 531 amino acids to 851 amino acids, and they share 12.0% to 82.4% amino acid identities over their entire lengths. In addition, most FRS proteins contain one to three coiled-coil domains and one or two putative nuclear localization signals. Semiquantitative reverse transcription-polymerase chain reaction analyses revealed that all FRS genes except FRS10 are expressed in all tissues examined, including rosette leaves, cauline leaves, inflorescence stems, flowers, and siliques. Analyses of gene specific promoterGUS fusion reporter gene expression revealed that all FRS genes except FRS1 are expressed in hypocotyls, and their expression in hypocotyl is induced by far-red light treatment. Transient expression of green fluorescent protein tagged FRS fusion proteins in onion (Allium cepa) epidermal cells revealed that all FRS proteins are targeted into the nucleus. T-DNA knockout frs6 and frs8 mutants flowered early under both long-day and short-day conditions (with much more drastic effects under short-day conditions), suggesting that FRS6 and FRS8 regulate flowering time. In addition, FRS9 RNAi transgenic plants showed a specific hypersensitivity to red light inhibition of hypocotyl elongation and light-regulated gene expression, indicating that FRS9 is a specific negative regulator of phyB signaling mediating seedling deetiolation. In summary, our results support the notion that FRS family members play distinct roles in light control of Arabidopsis development, most likely by regulating nuclear gene expression.
Figures
Figure 1.
FRS1 gene structure.
Figure 2.
A phylogenetic tree of the FRS gene family based on amino acid sequences. The plot was obtained by the Cluster Method of the MegAlign program (DNAstar, Madison, WI).
Figure 3.
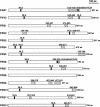
Diagram of predicted molecular structure of FRS proteins. Vertical bars, Putative NLSs. Slashed boxes, Putative coiled-coil domains.
Figure 4.
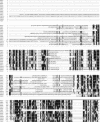
Amino acid sequence alignment between all FRS members. Identical and similar amino acid residues are shaded in black and gray, respectively. The Mutator transposase-homologous domain is indicated by a line above the sequences. The asterisks indicate the conserved Cys and His residues of the potential zinc-binding motif.
Figure 5.
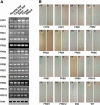
Expression patterns of the FRS genes. A, RT-PCR showing that all FRS genes (except FRS10) are expressed in all organs examined here (rosette leaf, cauline leaf, stem, flower, and silique). B, Histochemial staining of FRS_∷_GUS reporter gene transgenic lines. The left sections are histochemical staining of FR light-grown plants and the right sections are histochemical staining of dark-grown plants. 35S, transgenic plants harboring 35S promoter driven GUS reporter gene. WT, Wild-type nontransgenic plants (Col ecotype).
Figure 6.
Subcellular localization of GFP-FRS fusion proteins in onion epidermal cells. The top sections show GFP localization of the fusion proteins. The lower sections show DAPI staining of the corresponding images. Arrowheads indicate the positions of nuclei. Bar represents approximately 50 _μ_m.
Figure 7.
Analyses of frs6 and frs8 T-DNA insertion mutants. A, Diagram of the genomic structures of FRS6 and FRS8 genes and locations of T-DNA insertions. B, RT-PCR analysis showing that message RNAs of FRS6 and FRS8 were abolished in their respective frs homozygous mutants.
Figure 8.
Early flowering phenotype of frs6 and frs8 mutants. A and B, frs6 and frs8 mutants flower early under LD conditions. C and D, frs6 and frs8 mutants flower early under SD conditions. B and D show days to flower and the rosette leaf numbers of various plants at bolting under LD and SD conditions, respectively (based on the opening of first flower). Bar in A represents approximately 1 cm. Bar in C represents approximately 5 cm. Bars in B and D represent
sd
s.
Figure 9.
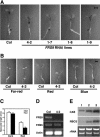
Phenotype of FRS9 RNAi transgenic plants. A, Four independent RNAi lines of FRS9 show hypersensitive response to continuous R light. Bar represents approximately 1 mm. B, FRS9 RNAi plants (represented by the transgenic line 4-2) are specifically hypersensitive to R light and display normal responses to FR and blue light. Bar represents approximately 1 mm. C, Quantification of hypocotyl lengths of seedlings grown in continuous darkness or R light for 4 d. D, RT-PCR showing that FRS9 mRNA accumulation is abolished in FRS9 RNAi plants (represented by the transgenic line 4-2), whereas accumulation of FRS5 mRNA is not affected. E, CAB and RBCS gene expression is enhanced in FRS9 RNAi plants compared with wild-type plants (grown in darkness for 4 d then transferred to continuous R light for 12 h). Col, Wild-type Col ecotype plants. 1, Col grown in darkness for 5 d; 2 and 3 are Col and FRS9 RNAi plants (line 4-2) grown in darkness for 4 d then transferred to continuous R light for 12 h.
Similar articles
- Discrete and essential roles of the multiple domains of Arabidopsis FHY3 in mediating phytochrome A signal transduction.
Lin R, Teng Y, Park HJ, Ding L, Black C, Fang P, Wang H. Lin R, et al. Plant Physiol. 2008 Oct;148(2):981-92. doi: 10.1104/pp.108.120436. Epub 2008 Aug 20. Plant Physiol. 2008. PMID: 18715961 Free PMC article. - Isolation and characterization of phyC mutants in Arabidopsis reveals complex crosstalk between phytochrome signaling pathways.
Monte E, Alonso JM, Ecker JR, Zhang Y, Li X, Young J, Austin-Phillips S, Quail PH. Monte E, et al. Plant Cell. 2003 Sep;15(9):1962-80. doi: 10.1105/tpc.012971. Plant Cell. 2003. PMID: 12953104 Free PMC article. - Multifaceted roles of FHY3 and FAR1 in light signaling and beyond.
Wang H, Wang H. Wang H, et al. Trends Plant Sci. 2015 Jul;20(7):453-61. doi: 10.1016/j.tplants.2015.04.003. Epub 2015 May 5. Trends Plant Sci. 2015. PMID: 25956482 Review. - The FHY3 and FAR1 genes encode transposase-related proteins involved in regulation of gene expression by the phytochrome A-signaling pathway.
Hudson ME, Lisch DR, Quail PH. Hudson ME, et al. Plant J. 2003 May;34(4):453-71. doi: 10.1046/j.1365-313x.2003.01741.x. Plant J. 2003. PMID: 12753585 - Emerging Roles of FHY3 and FAR1 as System Integrators in Plant Development.
Zheng Y, Sun Y, Liu Y. Zheng Y, et al. Plant Cell Physiol. 2023 Oct 16;64(10):1139-1145. doi: 10.1093/pcp/pcad068. Plant Cell Physiol. 2023. PMID: 37384577 Review.
Cited by
- Arabidopsis FHY3 and HY5 positively mediate induction of COP1 transcription in response to photomorphogenic UV-B light.
Huang X, Ouyang X, Yang P, Lau OS, Li G, Li J, Chen H, Deng XW. Huang X, et al. Plant Cell. 2012 Nov;24(11):4590-606. doi: 10.1105/tpc.112.103994. Epub 2012 Nov 13. Plant Cell. 2012. PMID: 23150635 Free PMC article. - Maintaining Genome Integrity during Seed Development in Phaseolus vulgaris L.: Evidence from a Transcriptomic Profiling Study.
Parreira JR, Balestrazzi A, Fevereiro P, Araújo SS. Parreira JR, et al. Genes (Basel). 2018 Sep 20;9(10):463. doi: 10.3390/genes9100463. Genes (Basel). 2018. PMID: 30241355 Free PMC article. - Genome-Wide Identification and Functional Characterization of FAR1-RELATED SEQUENCE (FRS) Family Members in Potato (Solanum tuberosum).
Chen Q, Song Y, Liu K, Su C, Yu R, Li Y, Yang Y, Zhou B, Wang J, Hu G. Chen Q, et al. Plants (Basel). 2023 Jul 7;12(13):2575. doi: 10.3390/plants12132575. Plants (Basel). 2023. PMID: 37447143 Free PMC article. - The Evolutionary Volte-Face of Transposable Elements: From Harmful Jumping Genes to Major Drivers of Genetic Innovation.
Nicolau M, Picault N, Moissiard G. Nicolau M, et al. Cells. 2021 Oct 29;10(11):2952. doi: 10.3390/cells10112952. Cells. 2021. PMID: 34831175 Free PMC article. Review. - A mixed-model approach for genome-wide association studies of correlated traits in structured populations.
Korte A, Vilhjálmsson BJ, Segura V, Platt A, Long Q, Nordborg M. Korte A, et al. Nat Genet. 2012 Sep;44(9):1066-71. doi: 10.1038/ng.2376. Epub 2012 Aug 19. Nat Genet. 2012. PMID: 22902788 Free PMC article.
References
- Alonso JM, Stepanova AN, Leisse TJ, Kim CJ, Chen H, Shinn P, Stevenson DK, Zimmerman J, Barajas P, Cheuk R, et al (2003) Genome-wide insertional mutagenesis of Arabidopsis thaliana. Science 301: 653–657 - PubMed
- Ang LH, Chattopadhyay S, Wei N, Oyama T, Okada K, Batschauer A, Deng XW (1998) Molecular interaction between COP1 and HY5 defines a regulatory switch for light control of Arabidopsis development. Mol Cell 1: 213–222 - PubMed
- Arabidopsis Genome Initiative (2000) Analysis of the genome sequence of the flowering plant Arabidopsis thaliana. Nature 408: 796–815 - PubMed
Publication types
MeSH terms
Substances
LinkOut - more resources
Full Text Sources
Molecular Biology Databases


