Models for excluded volume interaction between an unfolded protein and rigid macromolecular cosolutes: macromolecular crowding and protein stability revisited - PubMed (original) (raw)
Models for excluded volume interaction between an unfolded protein and rigid macromolecular cosolutes: macromolecular crowding and protein stability revisited
Allen P Minton. Biophys J. 2005 Feb.
Abstract
Statistical-thermodynamic models for the excluded volume interaction between an unfolded polypeptide chain and a hard sphere or hard rod cosolute are presented, permitting estimation of the free energy of transfer of a polypeptide chain with fixed radius of gyration from a dilute (ideal) solution to a solution containing volume fraction of either cosolute. Also presented is a general thermodynamic description of the equilibrium between a unique native state and a manifold of unfolded or partially unfolded states of a protein distinguished by their respective radii of gyration. Together with results of a Monte Carlo calculation of the distribution of radii of gyration of four different unfolded proteins published by Goldenberg in 2003, these models are used to estimate the effect of intermolecular excluded volume upon an experimentally measurable apparent two-state constant for equilibrium between native and nonnative conformations of each of the four proteins, and upon the experimentally measurable root mean-square radius of gyration of the unfolded protein. Model calculations predict that addition of inert cosolutes at volume fractions exceeding 0.1 stabilizes the native state relative to unfolded states by an amount that increases strongly with and with the size of the native protein relative to the size of inert cosolute, and results in significant compaction of the manifold of unfolded states. Predicted effects are in qualitative and/or semiquantitative accord with the results of several published experimental studies.
Figures
FIGURE 1
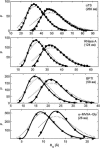
Distributions of the radius of gyration for four proteins. The relative abundance of conformations having a given value of _R_G is plotted as a function of the value of _R_G. Symbols indicate the results of Monte Carlo simulations of Goldenberg (2003), taking into account long-range steric interactions between nonadjacent chain segments (circles) and with neglect of long-range steric interactions (squares). Also plotted are the best-fit distributions of Lhullier (solid curves) and Flory and & Fisk (dotted curves), calculated using the parameter values given in Table 1.
FIGURE 2
Contribution of intramolecular excluded volume to the total chemical potential of a protein chain, calculated as a function of the radius of gyration according to Eq. 12 for _α_-TS (solid), RNase (dashed), BPTI (dot-dashed) and _ω_-MVII-Gly (dotted lines).
FIGURE 3
Density of residues (No. residues/Å3) plotted as a function of distance from the center of mass. Curves calculated according to Eq. 13 in the absence of intermolecular interaction for _α_-TS (solid), RNase (dashed), BPTI (dot-dashed) and _ω_-MVII-Gly (dotted lines).
FIGURE 4
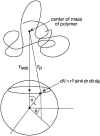
Spherical polar coordinate system for calculating steric interaction between a hard sphere centered at the origin and an unfolded protein chain with center of mass located at a distance of _r_sep along the z axis.
FIGURE 5
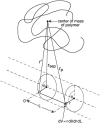
Cylindrical polar coordinate system for calculating steric interaction between a hard cylinder and an unfolded protein with center of mass located at a distance _r_sep normal to the cylinder axis.
FIGURE 6
Equilibrium average properties of four simulated proteins, plotted as functions of the volume fraction of hard spherical cosolute. (Top row) Thermodynamic activity coefficients of the native state (squares), the denatured “average state”, calculated using the Gaussian coil model with neglect of long-range intramolecular steric interaction (triangles), taking into account long-range intramolecular steric interaction (circles), and calculated using the equivalent hard sphere model with long-range intramolecular steric interaction (diamonds). (Middle row) Root mean-square radius of gyration of denatured “average state”, calculated using the Gaussian coil model with neglect of long-range intramolecular interaction (triangles), taking into account long-range intramolecular steric interaction (circles), and calculated using the equivalent hard sphere model with long-range intramolecular steric interaction (diamonds). Horizontal dotted line indicates _R_G (native). (Bottom row) Change in the apparent two-state equilibrium constant for unfolding. Symbols denote different models as described above for the middle row.
FIGURE 7
Equilibrium average properties of four simulated proteins, plotted as functions of the volume fraction of hard rod cosolute. (Top row) Thermodynamic activity coefficients of the native state (squares), the denatured “average state”, calculated using the Gaussian coil model taking into account long-range intramolecular steric interaction (circles), and calculated using the equivalent hard sphere model with long-range intramolecular steric interaction (diamonds). (Middle row) Root mean-square radius of gyration of denatured “average state”, calculated using the Gaussian coil model taking into account long-range intramolecular steric interaction (circles), and calculated using the equivalent hard sphere model with long-range intramolecular steric interaction (diamonds). Horizontal dotted line indicates _R_G (native). (Bottom row) Change in the apparent two-state equilibrium constant for unfolding. Symbols denote different models as described above for the middle row.
FIGURE 8
Distribution of the radius of gyration of two simulated proteins, calculated taking into account long-range intramolecular steric interaction (panels A and _A_′), and neglecting long-range intramolecular steric interaction (panels B and _B_′). Solid curves with unprimed labels were obtained using the Gaussian cloud model, and dashed curves with primed labels (panels A and _A_′ only) were obtained using the equivalent hard sphere model. The vertical dotted line corresponds to the radius of gyration of the native state, as reported by Goldenberg (2003). Plotted distributions were calculated for φ = 0, 0.1, 0.2, 0.3, and 0.4 (curves a_–_e, respectively).
FIGURE 9
Dependence of the effective hard sphere radius for two-body excluded volume interaction upon radius of gyration. Vertical dotted lines in each plot indicate the radius of gyration of the native state of the respective test protein (Goldenberg, 2003). Solid curves are the result of the equivalent hard sphere approximation, in which the effective hard sphere radius is proportional to the radius of gyration. Dashed and dot-dashed curves are the results of Gaussian cloud model calculations of excluded volume interaction of each polypeptide chain with a hard sphere and hard rod cosolute, respectively.
FIGURE 10
Dependence of the equilibrium constant for unfolding upon fractional volume occupancy of dextran. (Solid squares) Calculated from the experimental results of Sasahara et al. (2003) for the two state transition between molten globule and fully unfolded forms of cytochrome c at pH 2.0, with _v_exclusion = 0.8 cm3/g (Rivas et al., 1999). (Open symbols) Calculated for each of the four test proteins using the Gaussian cloud model of the unfolded state(s). (Dotted line) _ω_-MVIIa-gly. (Dot-dashed line) BPTI. (Dashed line) RNase. (Solid line) _α_-TS.
FIGURE 11
Fraction of folded ribonuclease A at pH 3.0, plotted as a function of the fractional volume occupancy of Ficoll 70. Points calculated from molar ellipticity data of Tokuriki et al. (2004) at 222 nm (circles) and 275 nm (squares). Curves represent best fits of Eqs. 40) and 42 to the data when the activity coefficients are calculated using expressions given in the text for activity coefficients of folded and unfolded species given by the Gaussian cloud model for hard sphere crowder (solid curve) and hard rod crowder (dashed curve). Best fit parameter values for the hard sphere crowder model are _r_native/rcrowder = 0.34, _v_exclusion = 1.31 cm3/g.
FIGURE 12
Dependence of apparent hydrodynamic radius of PEG 11700 (solid circles) and calculated RMS radius of gyration of unfolded ribonuclease A (open squares) upon fractional volume occupancy by Ficoll 70. Data of Tokuriki et al. (2004), with _v_exclusion set equal to that obtained via the fitting procedure described in the Fig. 11 legend. Results of Gaussian coil model calculations scaled from Fig. 7.
Similar articles
- Coarse-grained strategy for modeling protein stability in concentrated solutions.
Cheung JK, Truskett TM. Cheung JK, et al. Biophys J. 2005 Oct;89(4):2372-84. doi: 10.1529/biophysj.105.062067. Epub 2005 Jul 22. Biophys J. 2005. PMID: 16040749 Free PMC article. - Protein stability in mixed solvents: a balance of contact interaction and excluded volume.
Schellman JA. Schellman JA. Biophys J. 2003 Jul;85(1):108-25. doi: 10.1016/S0006-3495(03)74459-2. Biophys J. 2003. PMID: 12829469 Free PMC article. - Role of arginine in protein refolding, solubilization, and purification.
Tsumoto K, Umetsu M, Kumagai I, Ejima D, Philo JS, Arakawa T. Tsumoto K, et al. Biotechnol Prog. 2004 Sep-Oct;20(5):1301-8. doi: 10.1021/bp0498793. Biotechnol Prog. 2004. PMID: 15458311 Review. - Protein complexes: structure prediction challenges for the 21st century.
Aloy P, Pichaud M, Russell RB. Aloy P, et al. Curr Opin Struct Biol. 2005 Feb;15(1):15-22. doi: 10.1016/j.sbi.2005.01.012. Curr Opin Struct Biol. 2005. PMID: 15718128 Review.
Cited by
- Crosstalk Between Alpha-Synuclein and Other Human and Non-Human Amyloidogenic Proteins: Consequences for Amyloid Formation in Parkinson's Disease.
Werner T, Horvath I, Wittung-Stafshede P. Werner T, et al. J Parkinsons Dis. 2020;10(3):819-830. doi: 10.3233/JPD-202085. J Parkinsons Dis. 2020. PMID: 32538869 Free PMC article. Review. - Polymeric crowding agents improve passive biomacromolecule encapsulation in lipid vesicles.
Dominak LM, Omiatek DM, Gundermann EL, Heien ML, Keating CD. Dominak LM, et al. Langmuir. 2010 Aug 17;26(16):13195-200. doi: 10.1021/la101903r. Langmuir. 2010. PMID: 20695558 Free PMC article. - Depletion interactions modulate the binding between disordered proteins in crowded environments.
Zosel F, Soranno A, Buholzer KJ, Nettels D, Schuler B. Zosel F, et al. Proc Natl Acad Sci U S A. 2020 Jun 16;117(24):13480-13489. doi: 10.1073/pnas.1921617117. Epub 2020 Jun 2. Proc Natl Acad Sci U S A. 2020. PMID: 32487732 Free PMC article. - Protein folding and assembly in confined environments: Implications for protein aggregation in hydrogels and tissues.
Simpson LW, Good TA, Leach JB. Simpson LW, et al. Biotechnol Adv. 2020 Sep-Oct;42:107573. doi: 10.1016/j.biotechadv.2020.107573. Epub 2020 Jun 6. Biotechnol Adv. 2020. PMID: 32512220 Free PMC article. Review. - The extent of protein hydration dictates the preference for heterogeneous or homogeneous nucleation generating either parallel or antiparallel β-sheet α-synuclein aggregates.
Camino JD, Gracia P, Chen SW, Sot J, de la Arada I, Sebastián V, Arrondo JLR, Goñi FM, Dobson CM, Cremades N. Camino JD, et al. Chem Sci. 2020 Oct 15;11(43):11902-11914. doi: 10.1039/d0sc05297c. eCollection 2020 Nov 21. Chem Sci. 2020. PMID: 33520152 Free PMC article.
References
- Bishop, M., and C. J. Saltiel. 1991. The distribution function of the radius of gyration of linear polymers in two and three dimensions. J. Chem. Phys. 95:606–607.
- Busch, N., T. Kim, and V. Bloomfield. 2000. Tracer diffusion of proteins in DNA solutions. 2. Green fluorescent protein in crowded DNA solutions. Macromolecules. 33:5932–5937.
- Chan, H. S., and K. A. Dill. 1991. “Sequence space soup” of proteins and copolymers. J. Chem. Phys. 95:3775–3787.
- Dautenhahn, J., and C. K. Hall. 1994. Monte Carlo simulation of off-lattice polymer chains: effective pair potentials in dilute solution. Macromolecules. 27:5399–5412.
- Debye, P., and F. Bueche. 1952. Distribution of segments in a coiling polymer molecule. J. Chem. Phys. 20:1337–1338.
Publication types
MeSH terms
Substances
LinkOut - more resources
Full Text Sources
Other Literature Sources


