Apoptotic and autophagic cell death induced by histone deacetylase inhibitors - PubMed (original) (raw)
Apoptotic and autophagic cell death induced by histone deacetylase inhibitors
Yufang Shao et al. Proc Natl Acad Sci U S A. 2004.
Abstract
Histone deacetylase (HDAC) inhibitors can induce programmed cell death in cancer cells, although the underlying mechanism is obscure. In this study, we show that two distinct HDAC inhibitors, butyrate and suberoylanilide hydroxamic acid (SAHA), induced caspase-3 activation and cell death in multiple human cancer cell lines. The activation of caspase-3 was via the mitochondria/cytochrome c-mediated apoptotic pathway because it was abrogated in mouse embryonic fibroblasts with knockout of Apaf-1, the essential mediator of the pathway. Overexpression of Bcl-XL in HeLa cells also blocked caspase activation by the HDAC inhibitors. Nevertheless, Apaf-1 knockout, overexpression of Bcl-XL, and pharmacological inhibition of caspase activity did not prevent SAHA and butyrate-induced cell death. The cells undergoing such caspase-independent death had unambiguous morphological features of autophagic cell death. Therefore, HDAC inhibitors can induce both mitochondria-mediated apoptosis and caspase-independent autophagic cell death. Induction of autophagic cell death by HDAC inhibitors has clear clinical implications in treating cancers with apoptotic defects.
Figures
Fig. 1.
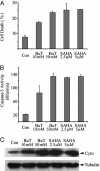
Butyrate and SAHA induced apoptosis, caspase-3 activation, and cytochrome c release in HeLa cells. HeLa cells were harvested after 2 days of treatment with indicated concentrations of butyrate or SAHA. (A) Cell death was measured by Hoechst dye 33342 staining followed by flow cytometry as described. BuT, butyrate; Con, control. (B) Cytosolic proteins of each sample were assayed for caspase-3 activity as described. (C) Cytosolic proteins (40 μg) were subjected to immunoblotting against cytochrome c (Cyto). Immunoblotting against β-tubulin was performed as the loading control.
Fig. 2.
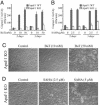
Apaf-1 is required for butyrate and SAHA-induced caspase-3 activation but not cell death. Apaf-1 wild-type (WT, filled bars) and knockout (KO, open bars) MEFs were harvested after the treatment with butyrate (A) or SAHA (B) for 2 days or 3 days, and caspase-3 activation was measured as described. Cell death of the KO cells was documented by light microscopy after treatment of butyrate (C) or SAHA (D) with indicated concentrations.
Fig. 3.
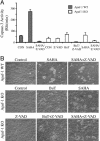
Butyrate and SAHA induced caspase-independent cell death. (A) Apaf-1 wild-type (WT, filled bars) and knockout MEFs (KO, open bars) were treated with 5 μM SAHA or 50 mM butyrate in the presence or absence of 40 μM Z-VAD-FMK (Z-VAD), as indicated. After treatment (2 days for the WT cells and 3 days for the KO cells), the cells were harvested for measurement of caspase-3 activity. (B) Microscopic pictures of the treated cells showing cell death.
Fig. 4.
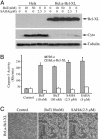
Overexpression of Bcl-XL blocked butyrate- and SAHA-induced cytochrome c release and caspase-3 activation, but not cell death. HeLa cell lines stably transfected with Bcl-XL (HeLa-Bcl-XL) or vector alone (HeLa) were treated for 2 days with various concentrations of butyrate or SAHA as indicated. (A) Cells were harvested, and cytosolic proteins (40 μg) were subjected to immunoblotting to detect Bcl-XL, cytochrome c, and β-tubulin. (B) Caspase-3 activity was measured after treatment (filled bars, control HeLa cells; open bars, Bcl-XL-overexpressing cells). (C) Two days after treatment with 10 mM butyrate or 2.5 μM SAHA, death of the Bcl-XL-overexpressing HeLa cells was documented by light microscopy.
Fig. 5.
HDAC inhibitors induced caspase-independent, autophagic cell death. (A_–_D) Apaf-1-knockout MEFs were treated without (A) or with (B_–_D) 5 μM SAHA for 36 h, and transmission electron microscopic study was conducted as described. Nuclei were labeled N. Autophagic structures, autophagosome (arrowheads) and autophagic vacuoles (arrows), were detected in SAHA-treated cells. C and D are pictures with higher magnification showing detailed autophagosome structure. (E and F) Bcl-XL-overexpressing HeLa cells, without (E) or with (F) treatment with 5 μM SAHA for 2 days. The arrowhead in F shows an autophagosome fusing with an autophagic vacuole. (G) Arrowheads show double membrane structures approaching mitochondria (from a SAHA-treated Apaf-1-knockout MEF cell). (H) A SAHA-treated, Bcl-XL-overexpressing HeLa cell, containing a single large autophagic vacuole and very few mitochondria.
Similar articles
- The novel histone deacetylase inhibitor, N-hydroxy-7-(2-naphthylthio) hepatonomide, exhibits potent antitumor activity due to cytochrome-c-release-mediated apoptosis in renal cell carcinoma cells.
Park KC, Heo JH, Jeon JY, Choi HJ, Jo AR, Kim SW, Kwon HJ, Hong SJ, Han KS. Park KC, et al. BMC Cancer. 2015 Jan 23;15:19. doi: 10.1186/s12885-014-1003-1. BMC Cancer. 2015. PMID: 25613585 Free PMC article. - Histone deacetylase activity regulates apaf-1 and caspase 3 expression in the developing mouse retina.
Wallace DM, Donovan M, Cotter TG. Wallace DM, et al. Invest Ophthalmol Vis Sci. 2006 Jul;47(7):2765-72. doi: 10.1167/iovs.05-1383. Invest Ophthalmol Vis Sci. 2006. PMID: 16799012 - Histone deacetylase inhibitors in programmed cell death and cancer therapy.
Marks PA, Jiang X. Marks PA, et al. Cell Cycle. 2005 Apr;4(4):549-51. doi: 10.4161/cc.4.4.1564. Epub 2005 Apr 28. Cell Cycle. 2005. PMID: 15738652 Review. - Histone Deacetylase Inhibitor-Induced Autophagy in Tumor Cells: Implications for p53.
Mrakovcic M, Kleinheinz J, Fröhlich LF. Mrakovcic M, et al. Int J Mol Sci. 2017 Aug 31;18(9):1883. doi: 10.3390/ijms18091883. Int J Mol Sci. 2017. PMID: 30563957 Free PMC article. Review.
Cited by
- Autophagy as a target for cancer therapy: new developments.
Carew JS, Kelly KR, Nawrocki ST. Carew JS, et al. Cancer Manag Res. 2012;4:357-65. doi: 10.2147/CMAR.S26133. Epub 2012 Oct 11. Cancer Manag Res. 2012. PMID: 23091399 Free PMC article. - Cotargeting histone deacetylases and oncogenic BRAF synergistically kills human melanoma cells by necrosis independently of RIPK1 and RIPK3.
Lai F, Guo ST, Jin L, Jiang CC, Wang CY, Croft A, Chi MN, Tseng HY, Farrelly M, Atmadibrata B, Norman J, Liu T, Hersey P, Zhang XD. Lai F, et al. Cell Death Dis. 2013 Jun 6;4(6):e655. doi: 10.1038/cddis.2013.192. Cell Death Dis. 2013. PMID: 23744355 Free PMC article. - Role of autophagy in histone deacetylase inhibitor-induced apoptotic and nonapoptotic cell death.
Gammoh N, Lam D, Puente C, Ganley I, Marks PA, Jiang X. Gammoh N, et al. Proc Natl Acad Sci U S A. 2012 Apr 24;109(17):6561-5. doi: 10.1073/pnas.1204429109. Epub 2012 Apr 9. Proc Natl Acad Sci U S A. 2012. PMID: 22493260 Free PMC article. - ZNF322A-mediated protein phosphorylation induces autophagosome formation through modulation of IRS1-AKT glucose uptake and HSP-elicited UPR in lung cancer.
Cheung CHY, Hsu CL, Lin TY, Chen WT, Wang YC, Huang HC, Juan HF. Cheung CHY, et al. J Biomed Sci. 2020 Jun 23;27(1):75. doi: 10.1186/s12929-020-00668-5. J Biomed Sci. 2020. PMID: 32576196 Free PMC article. - Autophagy-related gene 7 (ATG7) and reactive oxygen species/extracellular signal-regulated kinase regulate tetrandrine-induced autophagy in human hepatocellular carcinoma.
Gong K, Chen C, Zhan Y, Chen Y, Huang Z, Li W. Gong K, et al. J Biol Chem. 2012 Oct 12;287(42):35576-35588. doi: 10.1074/jbc.M112.370585. Epub 2012 Aug 27. J Biol Chem. 2012. PMID: 22927446 Free PMC article.
References
- Hanahan, D. & Weinberg, R. A. (2000) Cell 100, 57–70. - PubMed
- Johnstone, R. W., Ruefli, A. A. & Lowe, S. W. (2002) Cell 108, 153–164. - PubMed
- Thornberry, N. A. & Lazebnik, Y. (1998) Science 281, 1312–1316. - PubMed
- Ashkenazi, A. & Dixit, V. M. (1998) Science 281, 1305–1308. - PubMed
- Peter, M. E. & Krammer, P. H. (2003) Cell Death Differ. 10, 26–35. - PubMed
Publication types
MeSH terms
Substances
LinkOut - more resources
Full Text Sources
Research Materials


