Urbanization, malaria transmission and disease burden in Africa - PubMed (original) (raw)
Review
Urbanization, malaria transmission and disease burden in Africa
Simon I Hay et al. Nat Rev Microbiol. 2005 Jan.
Abstract
Many attempts have been made to quantify Africa's malaria burden but none has addressed how urbanization will affect disease transmission and outcome, and therefore mortality and morbidity estimates. In 2003, 39% of Africa's 850 million people lived in urban settings; by 2030, 54% of Africans are expected to do so. We present the results of a series of entomological, parasitological and behavioural meta-analyses of studies that have investigated the effect of urbanization on malaria in Africa. We describe the effect of urbanization on both the impact of malaria transmission and the concomitant improvements in access to preventative and curative measures. Using these data, we have recalculated estimates of populations at risk of malaria and the resulting mortality. We find there were 1,068,505 malaria deaths in Africa in 2000 - a modest 6.7% reduction over previous iterations. The public-health implications of these findings and revised estimates are discussed.
Figures
Figure 1. Population totals from 1950–2050
The bar plots are stratified by urban (red) and rural (green) for the world (a) and Africa (b). Note that urban and rural population projections stop in 2030, after which total population is shown (blue). Data from the World Population Prospects Database (see the Online links box).
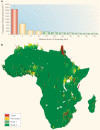
Figure 2. Mean population density (persons per km2) in 2000 of the 37 urban agglomerations (UA) in Africa
a | The bar plot shows the mean population density in 2000 of the 37 UA with more than one million inhabitants in 2003 at successive 5 km buffers from the UA edge. The Global Rural–Urban Mapping Project (GRUMP) urban mask, defined the spatial extent of the 37 UA. Overlaying this on the gridded population of the world version 3 (GPWv3) allowed the population associated with these classes to be shown in the bar plot: urban (red), peri-urban (yellow), rural 1 (light green) and rural 2 (dark green, off the scale). The core UA (defined by its GRUMP extent) has a population density >1,000 persons per km2; peri-urban areas (defined as between 5–15 km from the UA edge) have population densities 250–1,000 persons per km2 and rural areas (defined as >20 km from UA edge) have densities of <250 persons per km2. To prevent this rural stratification being biased towards high population densities (as we conservatively trained population density on the largest African UAs), the rural class was further divided into rural 1 (100–250 persons per km2 at 20–55 km from UA edge) and rural 2 (<100 persons per km2 at >55 km from the UA edge). The vertical lines indicate the standard errors. b | The map shows these population densities plotted across Africa using GPWv3 (REF. 97). The map is exaggerated vertically to help resolve small-area urban and peri-urban classes across Africa.
Figure 3. Bar plots of A_Pf_EIR by land-use category (a) and APfEIR by dry or wet ecozone (b)
The red bars in part b are pooled urban and peri-urban data and the green bars are pooled rural 1 and rural 2 data. Dry and wet areas were defined by satellite sensor measurements of <0.35 and >0.35 normalized difference vegetation index (NDVI),, respectively. The NDVI is a measure of photosynthetic activity or ‘greenness’ of a region, and is often used as a surrogate for moisture availability. In both plots the solid vertical lines indicate the standard error. A_Pf_EIR, annual P. falciparum entomological inoculation rates; ib/p/a, infected bites per person per annum; NDVI, normalized difference vegetation index.
Figure 4. Plot of PR by log10 A_Pf_EIR
The red dots are pooled urban and peri-urban data (n = 33) and the green dots are pooled rural 1 and rural 2 data (n = 88). The fit line is drawn for all data. A_Pf_EIR, annual P. falciparum entomological inoculation rates; ib/p/a, infected bites per person per annum; PR, parasite prevalence ratio.
Figure 5. Childhood mortality in Africa
a | A box-and-whisker plot of all-cause childhood mortality in children (0–4 years of age), shown as deaths per 1,000 children per annum. b | A box-and-whisker plot of malaria-specific mortality in children (0–4 years of age), shown as deaths per 1,000 children per annum. The median (thick central line) is shown with the 25% and 75% percentile ranges (box depth) and the maximum and minimum (T-bars). These data are plotted against categorical classes of the PR (class 2, marginal risk areas, PR 0–0.25, n = 8; class 3, acute seasonal transmission PR 0.25–0.75, n = 24; class 4, stable endemic transmission, PR >0.75, n = 15), (see FIG. 6). PR, parasite prevalence ratio.
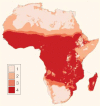
Figure 6. The MARA model of fuzzy climate suitability (FCS) for P. falciparum malaria transmission
FCS values vary between zero (totally unsuitable) to 1 (totally suitable) in an average year. The data are grouped into class 1 zero risk (FCS = 0), class 2 marginal risk (FCS 0–0.25), class 3 acute seasonal transmission (FCS 0.25–0.75) and class 4 stable endemic transmission (FCS >0.75),.
Figure 7. Plot of PR by log10 A_Pf_EIR
The blue circles and blue fit-line are the original data (see FIG. 4). The red (urban), yellow (peri-urban) and green (rural 1) fit-lines show the change in the relationship between A_Pf_EIR and PR predicted by the decrease A_Pf_EIR with urban intensity outlined in FIG. 3a. Class 1–4 emphasize the categorical separation of PR across Africa (FIG. 6). The solid arrows show levels of urbanization that result in movement between classes and dashed arrows those that do not. These categorical changes are then used in the population at risk estimates to calibrate burden estimates (TABLE 2). A_Pf_EIR, annual P. falciparum entomological inoculation rates; ib/p/a, infected bites/person/annum; PR, parasite prevalence ratio.
Similar articles
- Malaria transmission, infection, and disease at three sites with varied transmission intensity in Uganda: implications for malaria control.
Kamya MR, Arinaitwe E, Wanzira H, Katureebe A, Barusya C, Kigozi SP, Kilama M, Tatem AJ, Rosenthal PJ, Drakeley C, Lindsay SW, Staedke SG, Smith DL, Greenhouse B, Dorsey G. Kamya MR, et al. Am J Trop Med Hyg. 2015 May;92(5):903-12. doi: 10.4269/ajtmh.14-0312. Epub 2015 Mar 16. Am J Trop Med Hyg. 2015. PMID: 25778501 Free PMC article. - Africa's changing mosquito dynamics.
Shukla S. Shukla S. Lancet. 2012 Sep 29;380(9848):1130-1. doi: 10.1016/S0140-6736(12)61617-1. Lancet. 2012. PMID: 23021271 No abstract available. - [Lagoonal and coastal malaria at Cotonou: entomological findings].
Akogbéto M. Akogbéto M. Sante. 2000 Jul-Aug;10(4):267-75. Sante. 2000. PMID: 11111245 French. - Mosquitoes and transmission of malaria parasites - not just vectors.
Paul RE, Diallo M, Brey PT. Paul RE, et al. Malar J. 2004 Nov 8;3:39. doi: 10.1186/1475-2875-3-39. Malar J. 2004. PMID: 15533243 Free PMC article. Review. - The consequences of reducing transmission of Plasmodium falciparum in Africa.
Snow RW, Marsh K. Snow RW, et al. Adv Parasitol. 2002;52:235-64. doi: 10.1016/s0065-308x(02)52013-3. Adv Parasitol. 2002. PMID: 12521262 Review.
Cited by
- A regional-scale, high resolution dynamical malaria model that accounts for population density, climate and surface hydrology.
Tompkins AM, Ermert V. Tompkins AM, et al. Malar J. 2013 Feb 18;12:65. doi: 10.1186/1475-2875-12-65. Malar J. 2013. PMID: 23419192 Free PMC article. - Relative effects of climate factors and malaria control interventions on changes of parasitaemia risk in Burkina Faso from 2014 to 2017/2018.
Traoré N, Singhal T, Millogo O, Sié A, Utzinger J, Vounatsou P. Traoré N, et al. BMC Infect Dis. 2024 Feb 7;24(1):166. doi: 10.1186/s12879-024-08981-2. BMC Infect Dis. 2024. PMID: 38326750 Free PMC article. - Rapid diagnostic tests compared with malaria microscopy for guiding outpatient treatment of febrile illness in Tanzania: randomised trial.
Reyburn H, Mbakilwa H, Mwangi R, Mwerinde O, Olomi R, Drakeley C, Whitty CJ. Reyburn H, et al. BMJ. 2007 Feb 24;334(7590):403. doi: 10.1136/bmj.39073.496829.AE. Epub 2007 Jan 26. BMJ. 2007. PMID: 17259188 Free PMC article. Clinical Trial. - Statistical modeling of surveillance data to identify correlates of urban malaria risk: A population-based study in the Amazon Basin.
Corder RM, Paula GA, Pincelli A, Ferreira MU. Corder RM, et al. PLoS One. 2019 Aug 9;14(8):e0220980. doi: 10.1371/journal.pone.0220980. eCollection 2019. PLoS One. 2019. PMID: 31398228 Free PMC article. - The Importance of Local Context in National Malaria Elimination Efforts.
Wilson ML. Wilson ML. Am J Trop Med Hyg. 2023 Feb 27;108(4):637-638. doi: 10.4269/ajtmh.23-0041. Print 2023 Apr 5. Am J Trop Med Hyg. 2023. PMID: 36848890 Free PMC article. No abstract available.
References
- United Nations . World population monitoring 2001: population, environment and development. United Nations; New York: 2001. [online], < http://www.un.org/esa/population/publications/wpm/wpm2001.pdf>.
- United Nations . World urbanization prospects: the 2001 revision. Data, tables and highlights. United Nations; New York: 2002. [online], < http://www.un.org/esa/population/publications/wup2001/wup2001dh.pdf>.
- Omran AR. The epidemiologic transition theory revisited thirty years later. World Health Stat. Q. 1998;51:99–199.
- Omran AR. Epidemiologic transition: a theory of the epidemiology of population change. Milbank Mem. Fund Q. 1971;49:509–538. - PubMed
- Omran AR. Epidemiologic transition: a preliminary update. J. Trop. Pediatr. 1983;29:305–316. - PubMed
Publication types
MeSH terms
LinkOut - more resources
Full Text Sources
Medical


