Desmoplasia measured by computer assisted image analysis: an independent prognostic marker in colorectal carcinoma - PubMed (original) (raw)
Desmoplasia measured by computer assisted image analysis: an independent prognostic marker in colorectal carcinoma
B Sis et al. J Clin Pathol. 2005 Jan.
Abstract
Aims: The assessment of desmoplasia by traditional semiquantitative methods does not provide reliable prognostic data. The aim of this study was to quantify desmoplasia by computerised image analysis in primary colorectal carcinomas and to investigate its ability to predict overall survival.
Methods: In total, 112 colorectal adenocarcinomas, with a median follow up of 66 months, were studied. The representative tumour sections were stained by the van Gieson method, which stains collagen rich stroma red. For quantitative histochemical measurement, digital images were analysed by a computerised image analysis program to calculate the percentage of red stained tissue area. The percentage of desmoplasia (PD) was related to conventional clinicopathological prognostic factors and overall survival.
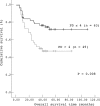
Results: The mean (SD) PD was 4.85 (3.37). PD was found to be significantly associated with lymph vessel and venous invasion. By Kaplan-Meier analysis, PD was associated with survival-patients with PD > 4 had a shorter survival than those with PD </= 4. In multivariate analysis, tumour stage, distant metastasis, and PD emerged as independent prognostic factors.
Conclusion: Desmoplasia measured by image analysis seems to be a significant prognostic indicator in patients with colorectal carcinoma and the improved method described in this study would be useful for routine prognostication.
Figures
Figure 1
Section of colorectal carcinoma stained with van Gieson (A) before and (B) after the selection of red colour.
Figure 2
Intraobserver agreement on the measurement of percentage of desmoplasia (PD). Test statistics: Spearman’s rank correlation test, r = 0.97, p ⩽ 0.001.
Figure 3
Interobserver agreement on the measurement of percentage of desmoplasia (PD). Test statistics: Spearman’s rank correlation test, r = 0.98, p ⩽ 0.001.
Figure 4
Mean percentage of desmoplasia in tumours in relation to clinical stage of disease.
Figure 5
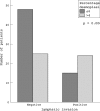
The distribution of lymphatic invasion in tumours according to the percentage of desmoplasia.
Figure 6
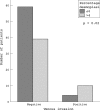
The distribution of venous invasion in tumours according to the percentage of desmoplasia.
Figure 7
Variation in the percentage of desmoplasia (PD) at each value of the semiquantitative grades for desmoplasia.
Figure 8
Kaplan–Meier overall survival curves for 112 patients with colorectal carcinoma grouped according to their percentage of desmoplasia (PD). Test statistics: log rank test (one degree of freedom), p = 0.008.
Similar articles
- Quantitative investigation of desmoplasia as a prognostic indicator in colorectal cancer.
Caporale A, Amore Bonapasta S, Scarpini M, Ciardi A, Vestri A, Ruperto M, Giuliani A. Caporale A, et al. J Invest Surg. 2010 Apr;23(2):105-9. doi: 10.3109/08941930903469417. J Invest Surg. 2010. PMID: 20497013 - Is desmoplasia a protective factor for survival in patients with colorectal carcinoma?
Caporale A, Vestri AR, Benvenuto E, Mariotti M, Cosenza UM, Scarpini M, Giuliani A, Mingazzini P, Angelico F. Caporale A, et al. Clin Gastroenterol Hepatol. 2005 Apr;3(4):370-5. doi: 10.1016/s1542-3565(04)00674-3. Clin Gastroenterol Hepatol. 2005. PMID: 15822042 - Immunohistochemical assessment of lymphovascular invasion in stage I colorectal carcinoma: prognostic relevance and correlation with nodal micrometastases.
Barresi V, Reggiani Bonetti L, Vitarelli E, Di Gregorio C, Ponz de Leon M, Barresi G. Barresi V, et al. Am J Surg Pathol. 2012 Jan;36(1):66-72. doi: 10.1097/PAS.0b013e31822d3008. Am J Surg Pathol. 2012. PMID: 21989343 - Lymphatic vessel invasion is a significant prognostic indicator in stage IA lung adenocarcinoma.
Funai K, Sugimura H, Morita T, Shundo Y, Shimizu K, Shiiya N. Funai K, et al. Ann Surg Oncol. 2011 Oct;18(10):2968-72. doi: 10.1245/s10434-011-1729-9. Epub 2011 Apr 22. Ann Surg Oncol. 2011. PMID: 21512862 - Histopathologic prognostic factors in resected colorectal lung metastases.
Shiono S, Ishii G, Nagai K, Yoshida J, Nishimura M, Murata Y, Tsuta K, Nishiwaki Y, Kodama T, Ochiai A. Shiono S, et al. Ann Thorac Surg. 2005 Jan;79(1):278-82; discussion 283. doi: 10.1016/j.athoracsur.2004.06.096. Ann Thorac Surg. 2005. PMID: 15620957 Review.
Cited by
- Positive and negative influence of the matrix architecture on antitumor immune surveillance.
Peranzoni E, Rivas-Caicedo A, Bougherara H, Salmon H, Donnadieu E. Peranzoni E, et al. Cell Mol Life Sci. 2013 Dec;70(23):4431-48. doi: 10.1007/s00018-013-1339-8. Epub 2013 May 7. Cell Mol Life Sci. 2013. PMID: 23649148 Free PMC article. Review. - Tumor stroma as targets for cancer therapy.
Zhang J, Liu J. Zhang J, et al. Pharmacol Ther. 2013 Feb;137(2):200-15. doi: 10.1016/j.pharmthera.2012.10.003. Epub 2012 Oct 12. Pharmacol Ther. 2013. PMID: 23064233 Free PMC article. Review. - Collagen-binding proteoglycan fibromodulin can determine stroma matrix structure and fluid balance in experimental carcinoma.
Oldberg A, Kalamajski S, Salnikov AV, Stuhr L, Mörgelin M, Reed RK, Heldin NE, Rubin K. Oldberg A, et al. Proc Natl Acad Sci U S A. 2007 Aug 28;104(35):13966-71. doi: 10.1073/pnas.0702014104. Epub 2007 Aug 22. Proc Natl Acad Sci U S A. 2007. PMID: 17715296 Free PMC article. - Identification of a high-risk subtype of intestinal-type Japanese gastric cancer by quantitative measurement of the luminal tumor proportion.
Aoyama T, Hutchins G, Arai T, Sakamaki K, Miyagi Y, Tsuburaya A, Ogata T, Oshima T, Earle S, Yoshikawa T, Grabsch HI. Aoyama T, et al. Cancer Med. 2018 Oct;7(10):4914-4923. doi: 10.1002/cam4.1744. Epub 2018 Aug 29. Cancer Med. 2018. PMID: 30160049 Free PMC article. - The desmoplastic reaction surrounding hepatic colorectal adenocarcinoma metastases aids tumor growth and survival via alphav integrin ligation.
Conti JA, Kendall TJ, Bateman A, Armstrong TA, Papa-Adams A, Xu Q, Packham G, Primrose JN, Benyon RC, Iredale JP. Conti JA, et al. Clin Cancer Res. 2008 Oct 15;14(20):6405-13. doi: 10.1158/1078-0432.CCR-08-0816. Clin Cancer Res. 2008. PMID: 18927279 Free PMC article.
References
- De Wever O , Mareel M. Role of tissue stroma in cancer cell invasion. J Pathol 2003;200:429–47. - PubMed
- Ohtani H . Stromal reaction in cancer tissue: pathophysiologic significance of the expression of matrix-degrading enzymes in relation to matrix turnover and immune/inflammatory reactions. Pathol Int 1998;48:1–9. - PubMed
- Hewitt RE, Powe DG, Carter GI, et al. Desmoplasia and its relevance to colorectal tumour invasion. Int J Cancer 1993;53:62–9. - PubMed
- Lioatta LA, Kohn EC. The microenvironment of the tumour–host interface. Nature 2001;411:375–9. - PubMed
- Tuxhorn JA, McAlhany SJ, Dang TD, et al. Stromal cells promote angiogenesis and growth of human prostate tumours in a differential reactive stroma (DRS) xenograft model. Cancer Res 2002;62:3298–307. - PubMed
MeSH terms
LinkOut - more resources
Full Text Sources
Medical


