Quantal size is independent of the release probability at hippocampal excitatory synapses - PubMed (original) (raw)
Quantal size is independent of the release probability at hippocampal excitatory synapses
Agota A Biró et al. J Neurosci. 2005.
Abstract
Short-term synaptic plasticity changes the reliability of transmission during repetitive activation and allows different neuronal ensembles to encode distinct features of action potential trains. Identifying the mechanisms and the locus of expression of such plasticity is essential for understanding neuronal information processing. To determine the quantal parameters and the locus of alterations during short-term plasticity of cortical glutamatergic synapses, EPSCs were evoked in hippocampal oriens-alveus interneurons by CA1 pyramidal cells. The robust short-term facilitation of this connection allowed us to examine the transmission under functionally relevant but widely different release probability (P(r)) conditions. Paired whole-cell recordings permitted the functional and post hoc morphological characterization of the synapses. To determine the quantal size (q), the P(r), and the number of functional release sites (N(F)), two independent quantal analysis methods were used. Light and electron microscopy were performed to identify the number of synaptic junctions (N(EM)) between the recorded cells. The mean number of functional release sites (N(F(f)) = 2.9 +/- 0.4; n = 8) as inferred from a simple binomial model with no quantal variance agreed well with the mean of N(EM) (2.8 +/- 0.8; n = 6), but N(F(f)) never matched N(EM) when they were compared in individual pairs; however, including quantal variance in the model improved the functional prediction of the structural data. Furthermore, an increased P(r) (4.8 +/- 0.8-fold) fully accounted for the marked short-term facilitation of EPSCs (5.0 +/- 0.7-fold), and q was independent of P(r). Our results are consistent with the "one-release site, one-vesicle" hypothesis.
Figures
Figure 2.
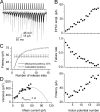
Short-term facilitation of unitary EPSCs evoked by a CA1 PC in an oriens-alveus IN (pair, AB383). A, Trains of action potentials (top) in the presynaptic PC evoke facilitating EPSCs in the IN (individual traces, light gray; averaged EPSC, black). B, Peak amplitudes of averaged EPSCs, failure rates, and potency amplitudes (averaged EPSCs excluding failures) are plotted as a function of action potential number. C, Using a simple binomial model with the failure method, we calculated the potency amplitudes at high _P_r conditions (open symbols) for integer numbers of N ranging from 1 to 15 (for calculation see Materials and Methods). _N_F(f) equals the smallest binomial N (3) at which the calculated potency is within 5% of the measured potency at the end of the train. D, Mean current and the variance values of the postsynaptic responses were calculated at each AP of the train and a multinomial quantal model was fitted to the data, resulting in an _N_F(MPFA) of 4, a q of 24. 7 pA, and _P_r ranging from 0.05 to 0.49 (same pair as shown in _A_-C).
Figure 3.
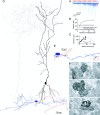
Functional and structural determination of the number of release sites for a PC-IN pair. A, Trains of presynaptic APs (red traces) evoked EPSCs in the postsynaptic IN (pair, AB377), which showed robust short-term facilitation (individual traces, light blue; averaged trace, dark blue). B, Potency amplitudes were calculated with a simple binomial model for integer _N_s from 1 to 15. The calculated potency at N = 2 was almost identical to the measured potency at the end of the stimulus train, yielding _N_F(f) of 2. C, Multiple probability fluctuation analysis with a multinomial model also resulted in an _N_F(MPFA) of 2. The quantal size is 39.6 pA, and the _P_r ranges from 0.07 to 0.39. D, LM reconstruction of the biocytin-labeled cells. The soma and dendrites of the presynaptic PC are shown in black; its axon arbor is red. The IN is classified as an O-LM cell based on the location of the soma and dendrites (blue) in the alveus and the extensive arborizations of its axon (gray) in the stratum lacunosum-moleculare. E, Locations of the three synaptic contacts (arrows) are shown at a higher magnification. Only parts of the IN and the PC are shown that establish the contacts. F, Electron microscopic images of the synaptic junctions (arrows) between three PC axon terminals (b) and the postsynaptic dendrites. Scale bars, 0.2 μm.
Figure 4.
Determination of _N_F and _N_EM for a PC-IN pair. A, Postsynaptic responses (individual traces, light blue; averaged trace, dark blue) evoked by a PC (action potentials in red) in an oriens-alveus IN (pair, AB390) show a pronounced short-term facilitation. B, Potency amplitudes are plotted against action potential numbers during trains of presynaptic APs at 50 Hz. Only a slight increase in the potency was observed, although the _P_f is reduced from 0.83 to 0.29 from the beginning to the end of the train. C, From the measured _P_f and the potency amplitudes at the beginning and end of the train, _N_F(f) of 2 was obtained by using the failure method with a simple binomial model. D, Parabolic fit to the mean versus variance plot resulted in an estimate of _N_F(MPFA) of 1, a q of 30.6 pA, and _P_r ranging from 0.10 to 0.51. E, Light microscopic reconstruction of the presynaptic PC (soma and dendrites are in black and axons are in red) and the soma and dendrites of the IN (blue). The main axon of the IN (gray) was truncated during slicing. Inset shows the location of the contact site at a higher magnification. F, Responses of the IN to a depolarizing and a hyperpolarizing current pulse (±200 pA). G, An electron micrograph showing the synaptic junction (arrow) between the presynaptic bouton (b) and the postsynaptic dendrite. Scale bar, 0.2 μm.
Figure 1.
Rundown of postsynaptic responses during paired whole-cell recordings is prevented by the presynaptic application of 10 m
m l
-glutamic acid. A, Top panel, Charge of EPSCs is plotted against time during 30 min of paired recordings without
l
-glutamic acid in the presynaptic internal solution. Bottom panel, Six presynaptic action potentials and the corresponding averaged EPSCs at the beginning and end of the recordings. B, Top panel,
l
-glutamic acid (10 m
m
) in the presynaptic intracellular solution prevented the rundown of unitary EPSCs. Bottom panel, Averaged postsynaptic responses are virtually the same at the beginning and end of an 80 min recording.
Figure 5.
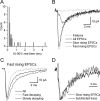
Kinetic properties of unitary EPSCs evoked by a PC on an IN. A, Distribution of 10-90% RTs of successful events evoked by the 16th AP of the presynaptic train (pair, AB377; same as shown in Fig. 3). The distribution is skewed toward larger values. Most of the EPSCs had a 10-90% RT <500 μsec, but seven events showed an RT >0.7 msec. The distribution suggests more than one population of events according to their rise times. B, Superimposed averaged traces with different kinetics. The average of failures is shown in gray and that of all EPSCs is black. Successful events were grouped according to their 10-90% RTs (A), and the averaged traces are shown in gray and light gray thick traces. C, Fast-rising EPSCs were grouped according to their decay times to fast- and slow-decaying events. The 10-90% RTs of the two groups were slightly different (fast decaying, 0.18 msec; slow decaying, 0.37 msec) and their amplitudes were almost identical (fast decaying, 56.4 pA; slow decaying, 55.2 pA), but their weighted decay time constants differed markedly (fast decaying, 0.88 msec; slow decaying, 2.7 msec). D, The decay kinetics of the slow-rising EPSCs (gray trace) is compared with the arithmetic difference between the fast-rising, slow-decaying and fast-rising, fast-decaying EPSCs (black trace). The decay of the two traces overlaps well, indicating that the fast-rising, slow-decaying events are the superimposition of slow-rising and fast-rising fast-decaying EPSCs. The peak amplitudes of the traces were normalized.
Similar articles
- Mechanisms of target-cell specific short-term plasticity at Schaffer collateral synapses onto interneurones versus pyramidal cells in juvenile rats.
Sun HY, Lyons SA, Dobrunz LE. Sun HY, et al. J Physiol. 2005 Nov 1;568(Pt 3):815-40. doi: 10.1113/jphysiol.2005.093948. Epub 2005 Aug 18. J Physiol. 2005. PMID: 16109728 Free PMC article. - Quantal analysis of excitatory synapses in rat hippocampal CA1 in vitro during low-frequency depression.
Larkman AU, Jack JJ, Stratford KJ. Larkman AU, et al. J Physiol. 1997 Dec 1;505 ( Pt 2)(Pt 2):457-71. doi: 10.1111/j.1469-7793.1997.457bb.x. J Physiol. 1997. PMID: 9423186 Free PMC article. - Different states of synaptic vesicle priming explain target cell type-dependent differences in neurotransmitter release.
Aldahabi M, Neher E, Nusser Z. Aldahabi M, et al. Proc Natl Acad Sci U S A. 2024 Apr 30;121(18):e2322550121. doi: 10.1073/pnas.2322550121. Epub 2024 Apr 24. Proc Natl Acad Sci U S A. 2024. PMID: 38657053 Free PMC article. - Estimation of quantal parameters at the calyx of Held synapse.
Sakaba T, Schneggenburger R, Neher E. Sakaba T, et al. Neurosci Res. 2002 Dec;44(4):343-56. doi: 10.1016/s0168-0102(02)00174-8. Neurosci Res. 2002. PMID: 12445623 Review. - Quantal analysis and synaptic anatomy--integrating two views of hippocampal plasticity.
Lisman JE, Harris KM. Lisman JE, et al. Trends Neurosci. 1993 Apr;16(4):141-7. doi: 10.1016/0166-2236(93)90122-3. Trends Neurosci. 1993. PMID: 7682347 Review.
Cited by
- Fluctuation analysis of tetanic rundown (short-term depression) at a corticothalamic synapse.
Ran I, Quastel DM, Mathers DA, Puil E. Ran I, et al. Biophys J. 2009 Mar 18;96(6):2505-31. doi: 10.1016/j.bpj.2008.12.3891. Biophys J. 2009. PMID: 19289074 Free PMC article. - Contrasting the functional properties of GABAergic axon terminals with single and multiple synapses in the thalamus.
Wanaverbecq N, Bodor AL, Bokor H, Slézia A, Lüthi A, Acsády L. Wanaverbecq N, et al. J Neurosci. 2008 Nov 12;28(46):11848-61. doi: 10.1523/JNEUROSCI.3183-08.2008. J Neurosci. 2008. PMID: 19005050 Free PMC article. - Evaluation of glutamate concentration transient in the synaptic cleft of the rat calyx of Held.
Budisantoso T, Harada H, Kamasawa N, Fukazawa Y, Shigemoto R, Matsui K. Budisantoso T, et al. J Physiol. 2013 Jan 1;591(1):219-39. doi: 10.1113/jphysiol.2012.241398. Epub 2012 Oct 15. J Physiol. 2013. PMID: 23070699 Free PMC article. - Modelling vesicular release at hippocampal synapses.
Nadkarni S, Bartol TM, Sejnowski TJ, Levine H. Nadkarni S, et al. PLoS Comput Biol. 2010 Nov 11;6(11):e1000983. doi: 10.1371/journal.pcbi.1000983. PLoS Comput Biol. 2010. PMID: 21085682 Free PMC article. - Distinctive quantal properties of neurotransmission at excitatory and inhibitory autapses revealed using variance-mean analysis.
Ikeda K, Yanagawa Y, Bekkers JM. Ikeda K, et al. J Neurosci. 2008 Dec 10;28(50):13563-73. doi: 10.1523/JNEUROSCI.3350-08.2008. J Neurosci. 2008. PMID: 19074030 Free PMC article.
References
- Abbott LF, Varela JA, Sen K, Nelson SB (1997) Synaptic depression and cortical gain control. Science 275: 220-224. - PubMed
- Barbour B, Hausser M (1997) Intersynaptic diffusion of neurotransmitter. Trends Neurosci 20: 377-384. - PubMed
Publication types
MeSH terms
Substances
LinkOut - more resources
Full Text Sources
Research Materials
Miscellaneous


