Notch-1 activation and dendritic atrophy in prion disease - PubMed (original) (raw)
Notch-1 activation and dendritic atrophy in prion disease
Nako Ishikura et al. Proc Natl Acad Sci U S A. 2005.
Abstract
In addition to neuronal vacuolation and astrocytic hypertrophy, dendritic atrophy is a prominent feature of prion disease. Because increased Notch-1 expression and cleavage releasing its intracellular domain (NICD) inhibit both dendrite growth and maturation, we measured their levels in brains from mice inoculated with Rocky Mountain Laboratory (RML) prions. The level of NICD was elevated in the neocortex, whereas the level of beta-catenin, which stimulates dendritic growth, was unchanged. During the incubation period, levels of the disease-causing prion protein isoform, PrPSc, and NICD increased concomitantly in the neocortex. Additionally, increased levels of Notch-1 mRNA and translocation of NICD to the nucleus correlated well with regressive dendritic changes. In scrapie-infected neuroblastoma (ScN2a) cells, the level of NICD was elevated compared with uninfected control (N2a) cells. Long neurofilament protein-containing processes extended from the surface of N2a cells, whereas ScN2a cells had substantially shorter processes. Transfection of ScN2a cells with a Notch-1 small interfering RNA decreased Notch-1 mRNA levels, diminished NICD concentrations, and rescued the long process phenotype. These results suggest that PrPSc in neurons and in ScN2a cells activates Notch-1 cleavage, resulting in atrophy of dendrites in the CNS and shrinkage of processes on the surface of cultured cells. Whether diminishing Notch-1 activation in vivo can prevent or even reverse neurodegeneration in prion disease remains to be established.
Figures
Fig. 1.
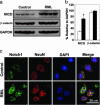
Increased concentrations of NICD but not β-catenin occur during RML infection in CD1 mice. (a) Western blot analysis of NICD (Notch-1 C20 antibody), β-catenin, and GAPDH in neocortical homogenates from four ill mice at 130 dpi and four age-matched control mice. Identical results were obtained with the cleaved Notch-1 Val-1744 antibody. (b) Densitometry estimates of the concentrations of NICD and β-catenin relative to GAPDH show a statistically significant 2.5-fold increase in NICD concentration (Student's t test; *, P < 0.0001) but no significant change in β-catenin during RML infection (filled bars) compared with controls (open bars). (c) Confocal microscopy shows accumulation of NICD in the nuclei of layer IV neurons in RML-infected mice at 140 dpi. In uninfected control neurons, merge shows small amounts of NICD mostly in the cytoplasm. A C-terminal Notch-1 antibody was used to localize NICD. A NeuN antibody was used to identify neurons. DAPI identifies nuclei.
Fig. 2.
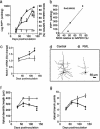
PrPSc accumulation in neocortical synaptosomes coincides with increased amounts of NICD, increased expression of Notch-1 mRNA, and regressive changes in dendrites. (a) Kinetics of the log of neocortical PrPSc accumulation in synaptosomes (filled squares) relative to NICD concentrations (filled circles) during the course of prion disease. NICD levels in age-matched PBS-inoculated mice are shown as controls (open circles). (b) A plot of synaptosomal PrPSc vs. NICD shows a high degree of correlation. (c) Quantitative RT-PCR measurements of Notch-1 mRNA levels at three time points during the course of prion disease (filled circles) relative to PBS-inoculated controls (open circles). (d and e) Camera lucida drawings of Golgi silver-stained dendritic trees show one type of regressive change; compare PBS-inoculated age-matched control cerebral cortex (d) with RML-infected cerebral cortex at 90 dpi (e). Note that the Golgi method stains only a small percentage of neurons. (f and g) Apical dendrite lengths (f) and numbers of apical dendrite branch points (g) during RML infection (filled circles) compared with uninoculated agematched controls (open circles) are shown. Data points and bars represent means and SEM, respectively, calculated from three independent experiments. *, P < 0.05; **, P < 0.005; ***, P < 0.0001 by Student's t test.
Fig. 3.
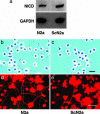
ScN2a cells have a higher concentration of NICD and fewer cells with neurites compared with N2a cells. (a) Western blots show ≈2× as much NICD in ScN2a cells (cleaved Notch-1 Val-1744 antibody). GADPH was used to normalize the data. (b and c) Phase-contrast microscopy shows that many N2a cells grew neurites that are more than two cell diameters in length (b); in contrast, most processes of ScN2a cells are less than two cell diameters in length (c). (d and e) Fluorescence immunohistochemistry shows that the cell bodies and long neurites of both N2a (d) and ScN2a cells (e) are immunopositive for the high molecular-weight neurofilament protein, NF200. N2a cells grew far more NF200-immunopositive neurites than ScN2a cells. (Bars = 90 μm; bar in c applies to b; bar in e applies to d.)
Fig. 4.
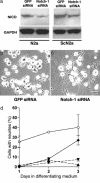
An siRNA against Notch-1 decreases NICD concentration by a mean of ≈30% in both N2a and ScN2a cells and rescues the long-neurite phenotype in ScN2a cells. (a) NICD levels in N2a and ScN2a cells are reduced 3 d after transfection with 5 nM Notch-1 siRNA (Notch-1-1, Ambion); in contrast, 5 nM GFP siRNA had no apparent effect. (b and c) Phase-contrast microscopy shows that ScN2a cells treated with Notch-1 siRNA (c) have longer processes than ScN2a cells treated with GFP siRNA (b) 3 d posttransfection and growth in differentiating medium. [Bar (c) = 80 μm and also applies to b.] (d) Cells with neurites measuring more than or equal to two cell diameters at different times points in differentiating medium expressed as a percentage of total cells. Data points and bars represent mean percentages and SEM, respectively, from at least three independent experiments. For transfection experiments, ≥1,000 cells were examined at each time point. Open circles, control N2a cells; filled diamonds, ScN2a cells treated with 5 nM Notch-1 siRNA; filled inverted triangles, ScN2a cells treated with 5 nM GFP siRNA; filled triangles, untreated ScN2a cells.
Similar articles
- A gamma-secretase inhibitor and quinacrine reduce prions and prevent dendritic degeneration in murine brains.
Spilman P, Lessard P, Sattavat M, Bush C, Tousseyn T, Huang EJ, Giles K, Golde T, Das P, Fauq A, Prusiner SB, Dearmond SJ. Spilman P, et al. Proc Natl Acad Sci U S A. 2008 Jul 29;105(30):10595-600. doi: 10.1073/pnas.0803671105. Epub 2008 Jul 22. Proc Natl Acad Sci U S A. 2008. PMID: 18647832 Free PMC article. - [Notch-1 is involved in neurodegeneration in prion diseases].
Ishikura N. Ishikura N. Nihon Rinsho. 2007 Aug;65(8):1397-400. Nihon Rinsho. 2007. PMID: 17695275 Review. Japanese. - Kinetics of expression of prion protein in uninfected and scrapie-infected N2a mouse neuroblastoma cells.
Pfeifer K, Bachmann M, Schröder HC, Forrest J, Müller WE. Pfeifer K, et al. Cell Biochem Funct. 1993 Mar;11(1):1-11. doi: 10.1002/cbf.290110102. Cell Biochem Funct. 1993. PMID: 8095862 - Prion encephalopathies of animals and humans.
Prusiner SB. Prusiner SB. Dev Biol Stand. 1993;80:31-44. Dev Biol Stand. 1993. PMID: 8270114 Review.
Cited by
- Post-Developmental Roles of Notch Signaling in the Nervous System.
Salazar JL, Yang SA, Yamamoto S. Salazar JL, et al. Biomolecules. 2020 Jul 1;10(7):985. doi: 10.3390/biom10070985. Biomolecules. 2020. PMID: 32630239 Free PMC article. Review. - Conditional deletion of Notch1 and Notch2 genes in excitatory neurons of postnatal forebrain does not cause neurodegeneration or reduction of Notch mRNAs and proteins.
Zheng J, Watanabe H, Wines-Samuelson M, Zhao H, Gridley T, Kopan R, Shen J. Zheng J, et al. J Biol Chem. 2012 Jun 8;287(24):20356-68. doi: 10.1074/jbc.M112.349738. Epub 2012 Apr 13. J Biol Chem. 2012. PMID: 22505716 Free PMC article. - Notch1 signaling in pyramidal neurons regulates synaptic connectivity and experience-dependent modifications of acuity in the visual cortex.
Dahlhaus M, Hermans JM, Van Woerden LH, Saiepour MH, Nakazawa K, Mansvelder HD, Heimel JA, Levelt CN. Dahlhaus M, et al. J Neurosci. 2008 Oct 22;28(43):10794-802. doi: 10.1523/JNEUROSCI.1348-08.2008. J Neurosci. 2008. PMID: 18945887 Free PMC article. - Epigenetic Control of the Notch and Eph Signaling Pathways by the Prion Protein: Implications for Prion Diseases.
Hirsch TZ, Martin-Lannerée S, Reine F, Hernandez-Rapp J, Herzog L, Dron M, Privat N, Passet B, Halliez S, Villa-Diaz A, Lacroux C, Klein V, Haïk S, Andréoletti O, Torres JM, Vilotte JL, Béringue V, Mouillet-Richard S. Hirsch TZ, et al. Mol Neurobiol. 2019 Mar;56(3):2159-2173. doi: 10.1007/s12035-018-1193-7. Epub 2018 Jul 11. Mol Neurobiol. 2019. PMID: 29998397 - Identification of genetic modifiers of TDP-43 neurotoxicity in Drosophila.
Zhan L, Hanson KA, Kim SH, Tare A, Tibbetts RS. Zhan L, et al. PLoS One. 2013;8(2):e57214. doi: 10.1371/journal.pone.0057214. Epub 2013 Feb 27. PLoS One. 2013. PMID: 23468938 Free PMC article.
References
- Prusiner, S. B., Scott, M. R., DeArmond, S. J. & Cohen, F. E. (1998) Cell 93, 337-348. - PubMed
- Cohen, F. E., Pan, K.-M., Huang, Z., Baldwin, M., Fletterick, R. J. & Prusiner, S. B. (1994) Science 264, 530-531. - PubMed
- DeArmond, S. J., Mobley, W. C., DeMott, D. L., Barry, R. A., Beckstead, J. H. & Prusiner, S. B. (1987) Neurology 37, 1271-1280. - PubMed
- Jendroska, K., Heinzel, F. P., Torchia, M., Stowring, L., Kretzschmar, H. A., Kon, A., Stern, A., Prusiner, S. B. & DeArmond, S. J. (1991) Neurology 41, 1482-1490. - PubMed
- Hecker, R., Taraboulos, A., Scott, M., Pan, K.-M., Torchia, M., Jendroska, K., DeArmond, S. J. & Prusiner, S. B. (1992) Genes Dev. 6, 1213-1228. - PubMed
Publication types
MeSH terms
Substances
Grants and funding
- P01 AG002132/AG/NIA NIH HHS/United States
- P01 AG010770/AG/NIA NIH HHS/United States
- P01 AG021601/AG/NIA NIH HHS/United States
- AG021601/AG/NIA NIH HHS/United States
- AG02132/AG/NIA NIH HHS/United States
- AG10770/AG/NIA NIH HHS/United States
LinkOut - more resources
Full Text Sources


