Differential regulation of Abeta42-induced neuronal C1q synthesis and microglial activation - PubMed (original) (raw)
Differential regulation of Abeta42-induced neuronal C1q synthesis and microglial activation
Rong Fan et al. J Neuroinflammation. 2005.
Abstract
Expression of C1q, an early component of the classical complement pathway, has been shown to be induced in neurons in hippocampal slices, following accumulation of exogenous Abeta42. Microglial activation was also detected by surface marker expression and cytokine production. To determine whether C1q induction was correlated with intraneuronal Abeta and/or microglial activation, D-(-)-2-amino-5-phosphonovaleric acid (APV, an NMDA receptor antagonist) and glycine-arginine-glycine-aspartic acid-serine-proline peptide (RGD, an integrin receptor antagonist), which blocks and enhances Abeta42 uptake, respectively, were assessed for their effect on neuronal C1q synthesis and microglial activation. APV inhibited, and RGD enhanced, microglial activation and neuronal C1q expression. However, addition of Abeta10-20 to slice cultures significantly reduced Abeta42 uptake and microglial activation, but did not alter the Abeta42-induced neuronal C1q expression. Furthermore, Abeta10-20 alone triggered C1q production in neurons, demonstrating that neither neuronal Abeta42 accumulation, nor microglial activation is required for neuronal C1q upregulation. These data are compatible with the hypothesis that multiple receptors are involved in Abeta injury and signaling in neurons. Some lead to neuronal C1q induction, whereas other(s) lead to intraneuronal accumulation of Abeta and/or stimulation of microglia.
Figures
Figure 1
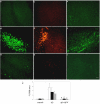
APV inhibited Aβ uptake, neuronal C1q production, and microglial activation. Slices were treated with no peptide (a, b, c), 30 μM Aβ 42 (d, e, f), or 30 μM Aβ 42 + 50 μM APV (g, h, i) for 3 days with fresh reagents added daily. Immunohistochemistry for Aβ (4G8, a, d, g), C1q (anti-rat C1q, b, e, h), and microglia (CD45, c, f, i) was performed on fixed and sectioned slices. Scale bar = 50 μm. Results are representative of three separately performed experiments. j. Immunoreactivity of Aβ (open bar), C1q (black bar), or CD45 (striped bar) was quantified as described in Materials and Methods. Values are the mean ± SD (error bars) from images taken from 8 slices (2 sections per slice) in 3 independent experiments (* p < 0.0001 compared to Aβ, Anova single factor test).
Figure 2
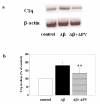
Inhibition of Aβ-induced C1q synthesis by APV. a. C1q and β-actin mRNAs were assessed by RT-PCR in slices after 3 days of no peptide, 30 μM Aβ, or 30 μM Aβ + 50 μM APV treatment. Results are from one experiment representative of two independent experiments. b. Slices were treated with no peptide (open bar), 30 μM Aβ (black bar), or 30 μM Aβ + 50 μM APV (striped bar) daily for 3 days. 3 or 4 slices that had received same treatment were pooled, extracted and proteins analyzed by ELISA. Data are presented as percentage of control in ng C1q/mg total protein (mean ± SD of three independent experiments, **p = 0.01 compared to Aβ, one-tailed paired t-test).
Figure 3
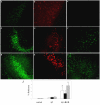
RGD enhanced Aβ uptake, neuronal C1q expression, and microglial activation. Hippocampal slices were treated with no peptide (a, b, c), 10 μM Aβ 42 (d, e, f), or 10 μM Aβ 42 + 2 mM RGD (g, h, i) for 3 days with fresh peptides added daily. Immunohistochemistry for Aβ (4G8, a, d, g), C1q (anti-rat C1q, b, e, h), and microglia (CD45, c, f, i) was performed on fixed slice sections. Scale bar = 50 μm. Results are representative of three separately performed experiments. j. Immunoreactivities of Aβ (open bar), C1q (black bar), or CD45 (striped bar) were quantified as described in Materials and Methods. Values are the mean ± SD (error bars) from images taken from 8 slices (2 sections per slice) in 3 independent experiments (* p < 0.0001, compared to Aβ, Anova single factor test).
Figure 4
Enhancement of Aβ-induced C1q synthesis by RGD. a. C1q and β-actin mRNAs were assessed by RT-PCR in slices after 3 days of no peptide, 10 μM Aβ, or 10 μM Aβ + 2 mM RGD treatment. Results are from one experiment representative of two independent experiments. b. Slices were treated with no peptide (open bar), 10 μM Aβ (black bar), or 10 μM Aβ + 2 mM RGD (striped bar) daily for 3 days. 3 or 4 slices that had received same treatment were pooled, extracted and proteins analyzed by ELISA. Data are presented as percentage of control in ng C1q/mg total protein (mean ± SD of three independent experiments, **p = 0.06 compared to Aβ, one-tailed paired t-test).
Figure 5
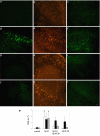
Aβ10–20 blocked Aβ42 uptake, microglial activation, but not neuronal C1q induction. Slices were treated with no peptide (a, b, c), 10 μM Aβ 42 (d, e, f), 10 μM Aβ 42 + 30 μM Aβ 10–20 (g, h, i) or 30 μM Aβ 10–20 (j, k, l) for 3 days with fresh peptides added daily. Immunohistochemistry for Aβ (4G8, a, d, g, j), C1q (anti-rat C1q, b, e, h, k), and microglia (CD45, c, f, i, l) was performed on fixed and sectioned slices. Results are representative of three independent experiments. Scale bar = 50 μm. m. Immunoreactivities of Aβ (open bar), C1q (black bar), or CD45 (striped bar) were quantified as described in Materials and Methods. Values are the mean ± SD (error bars) from images taken from 8 slices (2 sections per slice) in 3 independent experiments. Microglial activation by Aβ42 was significantly inhibited by Aβ10–20 (* p < 0.0001, compared to either Aβ42 + Aβ10–20 or Aβ10–20, Anova single factor test).
Figure 6
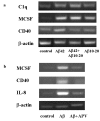
a. Aβ10–20 inhibited Aβ42-induced C1q and CD40 mRNA elevation, but not that of MCSF. C1q, MCSF, CD40, and β-actin mRNAs were assessed by RT-PCR in slices treated for 3 days with no peptide, 10 μM Aβ 42, 30 μM Aβ 10–20, or 10 μM Aβ 42 + 30 μM Aβ 10–20. Results are from one experiment representative of two independent experiments. b. APV blocked MCSF, CD40, and IL-8 mRNA induction triggered by Aβ42. RT-PCR for MCSF, CD40, IL-8, and β-actin were performed on RNA extracted from slices treated with no peptide (control), 30 μM Aβ 42, or 30 μM Aβ42 + 50 μM APV for 3 days. Results are from one experiment representative of two separate experiments.
Figure 7
Model of Aβ interaction with neurons and microglia in slice cultures. Exogenous Aβ peptide interacts with neuronal receptors leads to at least two separate consequences, in one of which C1q expression is upregulated in neurons. A second receptor mediates the secretion of certain modulatory molecules, which lead to microglial activation involving the expression of CD45, CR3, CD40, and IL-8. This does not exclude the direct interactions of Aβ with receptor(s) on microglia that may also contribute to microglial activation.
Similar articles
- Complement C1q expression induced by Abeta in rat hippocampal organotypic slice cultures.
Fan R, Tenner AJ. Fan R, et al. Exp Neurol. 2004 Feb;185(2):241-53. doi: 10.1016/j.expneurol.2003.09.023. Exp Neurol. 2004. PMID: 14736505 - Microglial activation and increased synthesis of complement component C1q precedes blood-brain barrier dysfunction in rats.
Lynch NJ, Willis CL, Nolan CC, Roscher S, Fowler MJ, Weihe E, Ray DE, Schwaeble WJ. Lynch NJ, et al. Mol Immunol. 2004 Jan;40(10):709-16. doi: 10.1016/j.molimm.2003.08.009. Mol Immunol. 2004. PMID: 14644096 - Complement component C1q modulates the phagocytosis of Abeta by microglia.
Webster SD, Yang AJ, Margol L, Garzon-Rodriguez W, Glabe CG, Tenner AJ. Webster SD, et al. Exp Neurol. 2000 Jan;161(1):127-38. doi: 10.1006/exnr.1999.7260. Exp Neurol. 2000. PMID: 10683279 - Activation of microglial cells and complement following traumatic injury in rat entorhinal-hippocampal slice cultures.
Bellander BM, Bendel O, Von Euler G, Ohlsson M, Svensson M. Bellander BM, et al. J Neurotrauma. 2004 May;21(5):605-15. doi: 10.1089/089771504774129937. J Neurotrauma. 2004. PMID: 15165368
Cited by
- Complement component C1q regulates macrophage expression of Mer tyrosine kinase to promote clearance of apoptotic cells.
Galvan MD, Foreman DB, Zeng E, Tan JC, Bohlson SS. Galvan MD, et al. J Immunol. 2012 Apr 15;188(8):3716-23. doi: 10.4049/jimmunol.1102920. Epub 2012 Mar 14. J Immunol. 2012. PMID: 22422887 Free PMC article. - C-reactive protein: the nexus between inflammation and protein misfolding diseases.
Roy A, Zeller J, Nero TL, Klepetko J, Eisenhardt SU, Parker MW, McFadyen JD, Peter K. Roy A, et al. Front Immunol. 2025 Jun 4;16:1612703. doi: 10.3389/fimmu.2025.1612703. eCollection 2025. Front Immunol. 2025. PMID: 40534869 Free PMC article. Review. - Microbiota-microglia connections in age-related cognition decline.
Zhou R, Qian S, Cho WCS, Zhou J, Jin C, Zhong Y, Wang J, Zhang X, Xu Z, Tian M, Chan LWC, Zhang H. Zhou R, et al. Aging Cell. 2022 May;21(5):e13599. doi: 10.1111/acel.13599. Epub 2022 Mar 29. Aging Cell. 2022. PMID: 35349746 Free PMC article. Review. - C1q-induced LRP1B and GPR6 proteins expressed early in Alzheimer disease mouse models, are essential for the C1q-mediated protection against amyloid-β neurotoxicity.
Benoit ME, Hernandez MX, Dinh ML, Benavente F, Vasquez O, Tenner AJ. Benoit ME, et al. J Biol Chem. 2013 Jan 4;288(1):654-65. doi: 10.1074/jbc.M112.400168. Epub 2012 Nov 13. J Biol Chem. 2013. PMID: 23150673 Free PMC article. - Complement C3 and C4 expression in C1q sufficient and deficient mouse models of Alzheimer's disease.
Zhou J, Fonseca MI, Pisalyaput K, Tenner AJ. Zhou J, et al. J Neurochem. 2008 Sep;106(5):2080-92. doi: 10.1111/j.1471-4159.2008.05558.x. Epub 2008 Jul 9. J Neurochem. 2008. PMID: 18624920 Free PMC article.
References
LinkOut - more resources
Full Text Sources
Other Literature Sources
