Reciprocal and dynamic control of CD8 T cell homing by dendritic cells from skin- and gut-associated lymphoid tissues - PubMed (original) (raw)
Reciprocal and dynamic control of CD8 T cell homing by dendritic cells from skin- and gut-associated lymphoid tissues
J Rodrigo Mora et al. J Exp Med. 2005.
Abstract
T cell activation by intestinal dendritic cells (DC) induces gut-tropism. We show that, reciprocally, DC from peripheral lymph nodes (PLN-DC) induce homing receptors promoting CD8 T cell accumulation in inflamed skin, particularly ligands for P- and E-selectin. Differential imprinting of tissue-tropism was independent of Th1/Th2 cytokines and not restricted to particular DC subsets. Fixed PLN-DC retained the capacity to induce selectin ligands on T cells, which was suppressed by addition of live intestinal DC. By contrast, fixed intestinal DC failed to promote gut-tropism and instead induced skin-homing receptors. Moreover, the induction of selectin ligands driven by antigen-pulsed PLN-DC could be suppressed "in trans" by adding live intestinal DC, but PLN-DC did not suppress gut-homing receptors induced by intestinal DC. Reactivation of tissue-committed memory cells modified their tissue-tropism according to the last activating DC's origin. Thus, CD8 T cells activated by DC acquire selectin ligands by default unless they encounter fixation-sensitive signal(s) for gut-tropism from intestinal DC. Memory T cells remain responsive to these signals, allowing for dynamic migratory reprogramming by skin- and gut-associated DC.
Figures
Figure 1.
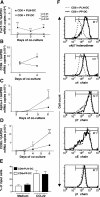
Reciprocal control of T cell homing potential by DC from skin-draining LN and PP. Naïve P14 CD8 T cells were cultured with peptide-pulsed PLN-DC or PP-DC and analyzed after different time intervals for the expression of skin- (E- and P-selectin ligands) and gut-homing molecules (α4β7 and CCR9). (A) Kinetics of the induction of skin- and gut-homing molecules on CD8 T cells activated with PLN-DC or PP-DC. (B) Representative experiment showing the expression of skin- or gut-homing molecules on CFSE-labeled CD8 T cells activated with PLN-DC or PP-DC after 3 d of coculture. Vertical quadrant markers were set so that undivided CFSE-labeled input cells fall in the right quadrants. Arrows and numbers indicate cell divisions. Percent of gated cells in upper left quadrants is also shown. Relationship between the frequency (C) and MFI (D) of T cells expressing skin- and gut-homing molecules and the number of cells divisions of CD8 T cells activated with PLN-DC or PP-DC after 3 d of coculture. Gates were set on viable CD8+ T cells. Statistical analyses were performed using a paired Student's t test comparing CD8 T cells activated with PLN-DC vs. those activated with PP-DC (mean ± SEM, n = 5–16).
Figure 2.
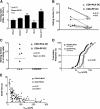
mRNA expression, chemotactic responsiveness, and integrin levels of CD8 T cells activated with PLN-DC or PP-DC. After different time intervals, CD8 T cells activated with PLN-DC or PP-DC were analyzed by real-time PCR for their relative mRNA expression of (A) fucosyltransferase-VII (FucT-VII), (B) the skin-associated chemokine receptor CCR4, as well as the gut homing molecules α4 integrin chain (C) and CCR9 (D). All mRNA levels were normalized with respect to GAPDH. Statistical analyses were performed using a paired Student's t test comparing CD8 T cells activated with PLN-DC vs. those activated with PP-DC (mean ± SEM, n = 3). (E) Chemotactic response toward the CCR4-ligand CCL22. Results are expressed as the percentage of total cells migrating toward a chemokine or toward medium alone. For chemotaxis experiments, cells were used after 4–6 d of coculture (mean ± SEM, n = 11). (F) Flow cytometry histograms showing expression of α4β7 heterodimer, α4, β7, αE, and β1 integrin chains on CD8 T cells activated with PLN-DC or PP-DC after 6 d of culture. Results show one representative experiment out of five performed with similar results. The marker (M1; indicating specific labeling) was set according to appropriate isotype controls.
Figure 3.
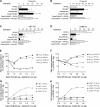
CD8 T cells activated with PLN-DC migrate more efficiently into inflamed skin and interact significantly better with cutaneous venules than those activated with PP-DC. CD8 T cells activated with PLN-DC or PP-DC were used at day 4–5 for homing experiments and IVM in mouse ear venules. (A) Competitive homing experiments between CD8 T cells activated with PLN-DC or PP-DC. Both populations were differentially labeled, mixed at a 1:1 ratio, and injected into naïve recipient mice. 18 h later, tissues were collected and the HI was calculated for each organ. IVM of T cell interactions in ear skin venules was used to determine (B) the rolling fraction and (C) the sticking fraction (n = venules/mice). (D) A cumulative rolling velocity histogram was generated by measuring rolling velocities (Vroll) of individual CD8 T cells activated with PLN-DC (median Vroll = 19 μm/s) and CD8 T cells activated with PP-DC (median Vroll = 38 μm/s) in ear venules by plotting the percentage of all cells that rolled at or below a given Vroll (n = cells/venules/mice). (E) Correlation between Vroll and the dwell time of individual rolling cells in each venule. The dwell time was measured as the time a T cell spent rolling within the venular segment that was used to measure Vroll. To compare homing experiments, results were analyzed using a one-sample t test (comparing experimental HI vs. HI = 1). To compare rolling and sticking fractions, a paired Student's t test was used comparing CD8 T cells activated with PLN-DC vs. those activated with PP-DC. The Mann-Whitney U-test was employed to compare Vroll of CD8 T cells activated with PLN-DC vs. those activated with PP-DC, and the Spearman rank correlation test was used for analysis of Vroll vs. dwell time.
Figure 4.
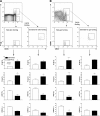
Effect of sorted DC subsets on the acquisition of selectin ligands and α4β7 on CD8 T cells. (A) DC from skin-draining LN or PP were isolated by negative selection and then subdivided by FACS sorting into CD11cLoB220+ (‘plasmacytoid’ DC) and CD11cHiB220Neg DC. The latter were further sorted into CD8αNegCD11bHi (“myeloid” DC), CD8αHiCD11bLo (“lymphoid” DC), and CD8αLo/-CD11bLo subsets. Each DC subpopulation was pulsed with peptide Ag and cocultured with naïve CD8 T cells for 5–6 d. Expression of (B) E- and (C) P-selectin ligands, (D) α4β7, and (E) LFA-1 on CD8 T cells activated with DC subsets from PLN or PP. Gates were set on viable CD8+ T cells. Statistical analyses were performed using a paired Student's t test comparing CD8 T cells activated with each PLN-DC subset vs. those activated with its PP-DC counterpart (mean ± SEM; n = 2–4).
Figure 5.
Effect of Th1/Th2 cytokines on the expression of selectin ligands, α4β7, and CCR9 on CD8 T cells activated with PLN-DC and PP-DC. (A) Naïve CD8 T cells were cultured with peptide-pulsed PLN-DC or PP-DC, either in the presence of blocking antibodies against IL-12, IFN-γ, or IL-4, and/or the cytokines themselves. CD8 T cells were analyzed after 4–5 d of coculture for expression of (A) E- and (B) P-selectin ligands, (C) α4β7, and (D) CCR9. Cells were gated on viable (FSC/SSC) CD8+ T cells. Results were normalized in each experiment to values from a parallel culture of untreated CD8 T cells activated with PP-DC (assigned a value of 100). To compare CD8 T cells activated with PP-DC or PLN-DC in the presence of cytokines and/or mAbs vs. the respective untreated CD8 T cells activated with the same DC, an ANOVA with Dunnett's post-test was used (*, P < 0.05; ***, P < 0.001). To compare CD8 T cells activated with PLN-DC vs. CD8 T cells activated with PP-DC in each group, a two-tailed paired Student's t test was used (#, P < 0.05; ###, P < 0.001). Only groups with n ≥ 3 independent experiments were used for statistical comparison. Bars reflect mean ± SEM.
Figure 6.
Effect of DC fixation and mixed DC cultures on homing molecule expression by T cells. (A–D) Naïve CD8 T cells were cultured with peptide-pulsed PLN-DC or PP-DC, which were either left untreated or fixed with 0.05% glutaraldehyde. CD8 T cells were analyzed after 4 d of coculture for expression of (A) E- and (B) P-selectin ligands, (C) α4β7, and (D) CCR9. Cells were gated on viable (FSC/SSC) CD8+ T cells. Results in A–D are expressed as percentage of marker-positive CD8 T cells. Bars represent mean ± SEM (mean ± range when n < 3). To compare CD8 T cells activated with unfixed PP-DC alone to cells activated under any other condition, an ANOVA with Dunnett's post-test was employed. (E–H) Naïve CD8 T cells (105/well) were cocultured with an equivalent number of Ag-pulsed PLN-DC (E and G) or PP-DC (F and H), with or without addition of unpulsed PLN-DC or PP-DC. Cells were analyzed after 4 d for the expression of selectin ligands (E and F) or α4β7 heterodimer and CCR9 (G and H). Cells were gated on viable CD8+ T cells. Results were normalized in each experiment to values from parallel cultures of CD8 T cells with Ag-pulsed PLN-DC (E and G) or PP-DC (F and H), which were arbitrarily assigned a value of 100. Symbols represent the average of two experiments with comparable results.
Figure 7.
Preservation of plasticity of ex vivo–generated tissue-tropic effector CD8 T cells. Naïve CD8 T cells were activated with either PLN-DC or PP-DC (1st activation) and the resulting effector T cells were restimulated 4–5 d later with either PLN-DC or PP-DC (2nd activation). 4–5 d after the second activation, effector cells were compared with naïve T cells (N) for expression of ligands for (A) E-selectin and (B) P-selectin or (C) α4β7 and (D) CCR9. Statistically significant (P < 0.05) differences were found for all markers analyzed between CD8 T cells activated with PLN-DC vs. those activated with PP-DC irrespective of the starting population. Statistical analyses were performed using ANOVA with Newman-Keuls post-test, comparing all groups of effector CD8 T cells at day 8–9 (mean ± SEM, n = 3-4).
Figure 8.
Plasticity of endogenous tissue-tropic effector–memory CD8 T cells. CD8 T cells were isolated by negative selection from pooled cells from spleen, PLN, MLN, and PP from 4–6-mo-old C57BL/6 wild-type mice, and the CD8+CD44High fraction was sorted by FACS into (A) P-Lig+ and P-LigNeg subsets or (B) CCR9+ and CCR9Neg subsets. The sorted cells were plated on immobilized anti-CD3+anti-CD28 and supplemented with either PLN-DC or PP-DC. The resulting effector CD8 T cells were analyzed 4 d later for their capacity to bind E- and P-selectin and their expression of α4β7 and CCR9. Statistical analyses were performed using a paired Student's t test comparing effector–memory CD8 T cells activated with PLN-DC vs. those activated with PP-DC (mean ± SEM, n = 3).
Similar articles
- Selective generation of gut tropic T cells in gut-associated lymphoid tissue (GALT): requirement for GALT dendritic cells and adjuvant.
Johansson-Lindbom B, Svensson M, Wurbel MA, Malissen B, Márquez G, Agace W. Johansson-Lindbom B, et al. J Exp Med. 2003 Sep 15;198(6):963-9. doi: 10.1084/jem.20031244. Epub 2003 Sep 8. J Exp Med. 2003. PMID: 12963696 Free PMC article. - Dendritic cells govern induction and reprogramming of polarized tissue-selective homing receptor patterns of T cells: important roles for soluble factors and tissue microenvironments.
Dudda JC, Lembo A, Bachtanian E, Huehn J, Siewert C, Hamann A, Kremmer E, Förster R, Martin SF. Dudda JC, et al. Eur J Immunol. 2005 Apr;35(4):1056-65. doi: 10.1002/eji.200425817. Eur J Immunol. 2005. PMID: 15739162 - Intestinal dendritic cells: their role in intestinal inflammation, manipulation by the gut microbiota and differences between mice and men.
Mann ER, Landy JD, Bernardo D, Peake ST, Hart AL, Al-Hassi HO, Knight SC. Mann ER, et al. Immunol Lett. 2013 Feb;150(1-2):30-40. doi: 10.1016/j.imlet.2013.01.007. Epub 2013 Jan 23. Immunol Lett. 2013. PMID: 23352670 Review. - Dendritic Cell-T-Cell Circuitry in Health and Changes in Inflammatory Bowel Disease and Its Treatment.
Knight SC. Knight SC. Dig Dis. 2016;34(1-2):51-7. doi: 10.1159/000442926. Epub 2016 Mar 16. Dig Dis. 2016. PMID: 26982806 Free PMC article. Review.
Cited by
- Tonsillar homing of Epstein-Barr virus-specific CD8+ T cells and the virus-host balance.
Hislop AD, Kuo M, Drake-Lee AB, Akbar AN, Bergler W, Hammerschmitt N, Khan N, Palendira U, Leese AM, Timms JM, Bell AI, Buckley CD, Rickinson AB. Hislop AD, et al. J Clin Invest. 2005 Sep;115(9):2546-55. doi: 10.1172/JCI24810. Epub 2005 Aug 18. J Clin Invest. 2005. PMID: 16110323 Free PMC article. - Dynamic T cell migration program provides resident memory within intestinal epithelium.
Masopust D, Choo D, Vezys V, Wherry EJ, Duraiswamy J, Akondy R, Wang J, Casey KA, Barber DL, Kawamura KS, Fraser KA, Webby RJ, Brinkmann V, Butcher EC, Newell KA, Ahmed R. Masopust D, et al. J Exp Med. 2010 Mar 15;207(3):553-64. doi: 10.1084/jem.20090858. Epub 2010 Feb 15. J Exp Med. 2010. PMID: 20156972 Free PMC article. - Functional specialization of gut CD103+ dendritic cells in the regulation of tissue-selective T cell homing.
Johansson-Lindbom B, Svensson M, Pabst O, Palmqvist C, Marquez G, Förster R, Agace WW. Johansson-Lindbom B, et al. J Exp Med. 2005 Oct 17;202(8):1063-73. doi: 10.1084/jem.20051100. Epub 2005 Oct 10. J Exp Med. 2005. PMID: 16216890 Free PMC article. - Generation, persistence and plasticity of CD4 T-cell memories.
Lees JR, Farber DL. Lees JR, et al. Immunology. 2010 Aug;130(4):463-70. doi: 10.1111/j.1365-2567.2010.03288.x. Epub 2010 May 10. Immunology. 2010. PMID: 20465569 Free PMC article. Review. - Role of retinoic acid in the imprinting of gut-homing IgA-secreting cells.
Mora JR, von Andrian UH. Mora JR, et al. Semin Immunol. 2009 Feb;21(1):28-35. doi: 10.1016/j.smim.2008.08.002. Epub 2008 Sep 18. Semin Immunol. 2009. PMID: 18804386 Free PMC article. Review.
References
- Butcher, E.C. 1991. Leukocyte-endothelial cell recognition: three (or more) steps to specificity and diversity. Cell. 67:1033–1036. - PubMed
- von Andrian, U.H., and C.R. Mackay. 2000. T-cell function and migration. Two sides of the same coin. N. Engl. J. Med. 343:1020–1034. - PubMed
- Masopust, D., V. Vezys, A.L. Marzo, and L. Lefrancois. 2001. Preferential localization of effector memory cells in nonlymphoid tissue. Science. 291:2413–2417. - PubMed
- Berlin, C., E.L. Berg, M.J. Briskin, D.P. Andrew, P.J. Kilshaw, B. Holzmann, I.L. Weissman, A. Hamann, and E.C. Butcher. 1993. α4 β7 integrin mediates lymphocyte binding to the mucosal vascular addressin MAdCAM-1. Cell. 74:185–195. - PubMed
Publication types
MeSH terms
Substances
Grants and funding
- AI-061663/AI/NIAID NIH HHS/United States
- HL56949/HL/NHLBI NIH HHS/United States
- HL54936/HL/NHLBI NIH HHS/United States
- HL62524/HL/NHLBI NIH HHS/United States
- R01 HL054936/HL/NHLBI NIH HHS/United States
- P01 HL056949/HL/NHLBI NIH HHS/United States
- R01 AI061663/AI/NIAID NIH HHS/United States
LinkOut - more resources
Full Text Sources
Other Literature Sources
Research Materials


