BACE overexpression alters the subcellular processing of APP and inhibits Abeta deposition in vivo - PubMed (original) (raw)
BACE overexpression alters the subcellular processing of APP and inhibits Abeta deposition in vivo
Edward B Lee et al. J Cell Biol. 2005.
Abstract
Introducing mutations within the amyloid precursor protein (APP) that affect beta- and gamma-secretase cleavages results in amyloid plaque formation in vivo. However, the relationship between beta-amyloid deposition and the subcellular site of Abeta production is unknown. To determine the effect of increasing beta-secretase (BACE) activity on Abeta deposition, we generated transgenic mice overexpressing human BACE. Although modest overexpression enhanced amyloid deposition, high BACE overexpression inhibited amyloid formation despite increased beta-cleavage of APP. However, high BACE expression shifted the subcellular location of APP cleavage to the neuronal perikarya early in the secretory pathway. These results suggest that the production, clearance, and aggregation of Abeta peptides are highly dependent on the specific neuronal subcellular domain wherein Abeta is generated and highlight the importance of perikaryal versus axonal APP proteolysis in the development of Abeta amyloid pathology in Alzheimer's disease.
Figures
Figure 1.
Generation of Tg mice overexpressing human BACE. (A) Schematic of the expression cassette used to generate PrP-BACE mice, containing the human BACE cDNA flanked by the 5′ UTR of the murine PrP gene containing an intron, and the 3′ UTR of the PrP gene. (B) BACE expression in Tg mice. RIPA lysates from the cortex, hippocampus, and cerebellum were immunoblotted for BACE using an antibody against the COOH terminus of human BACE. Three Tg lines (n > 3; shown are mice at 14–16 mo) were analyzed with low (30), medium (34), and high (8) expression. (C) BACE expression relative to non-Tg mice. Cortical RIPA lysates were diluted as indicated before immunoblotting for BACE using a polyclonal antisera against the entire NH2-terminal ectodomain of BACE. BACE-L, -M, and -H mice overexpress ∼7-, 10-, and 20-fold more BACE than non-Tg mice (n > 3 per genotype). No age-dependent changes in BACE expression have been observed (up to 20 mo). (D) Regional expression of BACE. Immunohistochemistry using BACE-N1 demonstrates increased immunoreactivity in BACE overexpressing mice. Representative images are shown of the cortex, striatum, cerebellum, brainstem, and spinal cord. Higher magnification shows staining of mossy fiber terminals, the granule cell layer of the cerebellum, and the dorsal spinal cord. Sections from APP (a–c) and BACE-H (d–i) mice are shown. Black arrowheads demonstrate synaptic/axonal staining, whereas white arrowheads show Purkinje cells. Wild-type/APP or BACE/BACExAPP mice showed no differences in staining (n > 2 per genotype). Similar staining was observed with a polyclonal antibody raised against the COOH terminus of BACE and polyclonal antibodies raised against the ectodomain of BACE. Bars: (a and d) 500 μm; (b and e) 500 μm; (c and f) 250 μm; (g) 150 μm; (h) 25 μm; (i)100 μm.
Figure 2.
Increase in β-cleavage due to BACE overexpression. (A) Diagram of sequential APP processing by BACE, α-secretase, and γ-secretase. (B) Steady-state levels of BACE and APP in monogenic and bigenic mice. RIPA lysates from wild-type, BACE, APP, and APPxBACE Tg mice (n = 3–5 per genotype) were immunoblotted for BACE and several APP species. BACE was probed with 84 (anti-BACE ectodomain). Total APP including full-length APP and all sAPP species was probed with Karen (anti–NH2 terminal APP). Two exposures are shown for optimal visualization of exogenous (light) and endogenous (dark) APP. Full-length APP was probed with 4G8. sAPPβswe, sAPPβ, and sAPPβ′ were probed with end-specific antibodies 54, C5A4 and C10A4, respectively. An immunoblot for β-tubulin is shown to demonstrate equal loading in all lanes. (C) Steady-state levels of COOH-terminal APP fragments in monogenic and bigenic mice. Whole brain RIPA lysates from wild-type, BACE, APP, and APPxBACE Tg mice were immunoprecipitated and immunoblotted with 5685 to recover COOH-terminal APP fragments. Select immunoprecipitates were dephosphorylated (right) before electrophoresis. White lines indicate that intervening lanes have been spliced out.
Figure 3.
BACE overexpression decreases steady-state Aβ levels. (A) Dose-dependent decrease in steady-state Aβ. Steady-state Aβ levels from RIPA cortical lysates (APP, n = 5; APPxBACE, n = 3 per genotype, 5–7 mo old) were quantified by Ban50-BA27/BC05 sandwich ELISA for full-length Aβ40 and Aβ42. (ANOVA, P < 0.0001; Bonferroni's post-hoc relative to APP, *P < 0.05, ***P < 0.001). (B) RIPA lysates were subject to immunoprecipitation with 4G8, followed by electrophoresis on a 10/16.5% Tris-tricine gel. Immunoblotting with 4G8 demonstrates the presence of full-length Aβ and p3 with little NH2- or COOH-terminally truncated Aβ variants (n = 2 per genotype). An overexposure of the immunoblot is shown to demonstrate the presence of p3 and the absence of other truncated Aβ peptides. White lines indicate that intervening lanes have been spliced out. (C) Steady-state Aβ levels from RIPA cortical lysates (n = 3–5 mice per genotype, 5–7 mo old) were quantified by JRF/c40-AβN or JRF/c42-AβN ELISA for full-length Aβ40 and Aβ42. (ANOVA, P = 0.0019; Bonferroni's post-hoc relative to APP, **P < 0.01). (D) Steady-state Aβ levels from RIPA cortical lysates (n = 3–5 mice per genotype, 5–7 mo old) were quantified by JRF/c40-m266 or JRF/c42-m266 ELISA for total (full-length and NH2-terminally truncated) Aβ40 and Aβ42. (ANOVA, P = 0.0015; Bonferroni's post-hoc relative to APP, ***P < 0.001).
Figure 4.
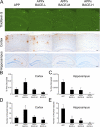
BACE overexpression inhibits Aβ amyloid formation. (A) Sections from APP or APPxBACE (-L, -M, and -H) littermates (n > 4 mice per genotype) were stained with thioflavin S for fibrillar amyloid deposits. Sections are from 14-mo-old mice, except for sections from APPxBACE-H mice which are 16 mo old. To corroborate thioflavin S staining, sections from the cortex and hippocampus were stained with NAB228. Bars: (top) 200 μm; (middle) 100 μm; (bottom) 200 μm. (B–D) Amyloid burden from sections (four sections/mouse) of APP or APPxBACE (-L, -M, and -H) littermates stained with NAB228 were analyzed by quantitative image analysis (n = 4 mice/genotype). For the somatosensory cortex, the percent area occupied by Aβ deposits (B, ANOVA, P = 0.05) and the number of Aβ deposits per section (C, ANOVA, P = 0.0219) are increased in APPxBACE-L mice relative to APP mice (Bonferroni's post-hoc relative to APP, *P < 0.05), whereas further increases in BACE expression inhibited Aβ deposition. For the hippocampus, the percent area occupied by Aβ deposits (C, ANOVA, P = 0.0099) and the number of Aβ deposits per section (D, ANOVA, P = 0.0034) indicated that BACE expression decreased Aβ deposition in all three BACE overexpressing lines. (Bonferroni's post-hoc relative to APP, *P < 0.05, **P < 0.01).
Figure 5.
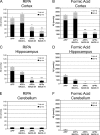
Quantification of Aβ accumulation in APP and APPxBACE mice. Different brain regions were sequentially extracted in RIPA buffer and 70% FA to obtain detergent-soluble and insoluble fractions. Aβ was quantified by Ban50-BA27/BC05 sandwich ELISA for full-length Aβ40 and Aβ42. All mice were 14 mo old except APPxBACE-H mice, which were 16 mo old. Quantification of soluble and insoluble cortical Aβ (A and B) indicated that relative to APP mice (n = 3 females, 1 male), low BACE expression (APPxBACE-L, n = 3 females, 1 male) increased cortical Aβ accumulation, whereas higher BACE expression inhibited Aβ accumulation (APPxBACE-M, n = 2 females, 1 male, and APPxBACE-H, n = 2 females, 1 male). ANOVA yielded P = 0.0006 and P < 0.0001 for soluble and insoluble cortical Aβ measurements, respectively. Quantification of soluble and insoluble hippocampal Aβ indicated that hippocampal Aβ accumulation decreased in a dose-dependent manner due to BACE overexpression (C and D). ANOVA yielded P = 0.0002 and 0.002 for soluble and insoluble hippocampal Aβ measurements, respectively. Both soluble and insoluble Aβ from the cerebellum were low in all genotypes (E and F). ANOVA failed to show any significance for data from cerebellar Aβ measurements. For cortical and hippocampal Aβ measurements, Bonferroni's post-test revealed significant differences relative to APP mice (*P < 0.05, **P < 0.01, ***P < 0.001).
Figure 6.
Decreased mature, phospho-APP in APPxBACE axons. (A) Biochemical markers of APP trafficking in APP and APPxBACE mice. Cortical lysates (n = 2–5 per genotype) were immunoprecipitated with 5685 (phosphorylation-independent COOH-terminal APP antibody) or PhAT and probed with NAB228 (anti-Aβ1-11, top) for C99 or with Karen (anti–NH2 terminus APP, bottom) for full-length APP. PhAT immunoprecipitations for full-length phospho-APP were performed with 10 times the material relative to 5685 immunoprecipitations. An overexposure of the immunoblot for full-length APP is shown to demonstrate the lack of immature APP in PhAT immunoprecipitates from APP mice, and the lack of phospho-APP in APPxBACE mice. (B) Regional analysis of mature APP species. RIPA lysates from various regions from APP or APPxBACE-H mice (n > 2 mice per genotype per region) were subject to immunoprecipitation with 5685 or PhAT followed by immunoblotting for full-length APP with Karen. White lines indicate that intervening lanes have been spliced out. (C) Intravitreal injections of 32P-labeled orthophosphate label retinal ganglion cells which send axonal projections via the optic nerve. 32P-labeled APP within the optic nerve is a measure of APP which has been phosphorylated and subject to anterograde axonal transport. (D) Transport of phospho-APP in optic nerves. 6 h after intravitreal injection of [32P]PO4, 32P-labeled full-length APP was recovered by immunoprecipitation with 5685 from optic nerves from APP mice, but not APPxBACE-H mice (7 and 15 mo old). Immunoblot of the same nitrocellulose membrane shows that 32P-labeled APP comigrates with only _N_- and _O_-glycosylated forms of APP, and that mature APP isoforms are depleted in optic nerves of APPxBACE-H mice. 32P-labeled NFM levels, assessed by immunoprecipitation with RMO26, were not affected by BACE overexpression. Three pairs of mice were analyzed and showed similar results.
Figure 7.
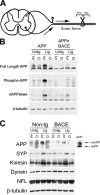
Decreased axonal transport and processing of APP in APPxBACE mice. (A) The sciatic nerve is a bundle of axons from sensory and motor neurons present in the dorsal root ganglion or the spinal cord. Upon ligation, proteins subject to anterograde axonal transport accumulate in the nerve segment proximal to the ligature. (B) Transport and processing of APP in ligated sciatic nerves. Sciatic nerves of APP or APPxBACE-H mice were ligated for 6 h. 5-mm segments proximal and distal to the ligature were homogenized, corrected for protein concentration, and immunoprecipitated with 5685 or PhAT. Segments from the unligated contralateral sciatic nerve were processed in parallel. Immunoprecipitates were immunoblotted with Karen for total full-length APP or full-length phospho-APP. Lysates were subject to another round of immunoprecipitation with Karen, followed by immunoblotting with 54 for sAPPβswe. Because β-tubulin levels are unchanged after 6 h of ligation, an immunoblot for β-tubulin is shown to demonstrate equal loading. Four pairs of mice were analyzed and showed similar results. (C) Endogenous APP axonal transport upon BACE overexpression. Sciatic nerves of non-Tg and monogenic BACE mice were ligated for 6 h (n = 3 pairs). Segments proximal and distal to the ligature were assessed for full-length APP by immunoprecipitation with 5685 and immunoblotting with Karen. Lysates were pooled due to the low level of endogenous APP within the sciatic nerve. Sciatic nerve from an APP mouse was run in parallel as a molecular weight marker. Immunoblots for synaptophysin, kinesin, dynein, NFL, and β-tubulin were also performed.
Figure 8.
Kinetic APP analysis of the spinal cord and sciatic nerve. L5 segments of non-Tg and BACE Tg spinal cords were injected with [35S]-methionine and analyzed at 0.5, 8, and 16 h after injection. (A) Full-length APP from spinal cords and sciatic nerves was immunoprecipitated with 5685 and electrophoresed on 7.5% Tris-glycine gels to examine the turnover of APP in vivo. Despite differences in APP levels, general radiolabeling of proteins is similar between non-Tg and BACE Tg mice, as determined by electrophoresis and autoradiography of immunoprecipitation supernatants. (B and C) Quantification of radiolabeled APP in spinal cords and sciatic nerves (n = 3 non-Tg, 2 BACE-H and 1 BACE-M per time point) demonstrated significantly lower levels of APP in both spinal cords and sciatic nerves (*P < 0.05, ***P < 0.0001), indicating that increased perikaryal APP proteolysis depletes mature, axonally transported APP.
Figure 9.
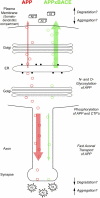
Subcellular processing of APP and the development of Aβ amyloid pathology. In monogenic APP mice (red), APP is synthesized in the ER and trafficked to the Golgi apparatus acquiring _N_- and _O_-linked oligosaccharides within these organelles. APP is targeted for fast anterograde axonal transport, coincident with phosphorylation of the COOH terminus of APP. A high proportion of β-cleavage occurs distally within an axonal or synaptic compartment where the likelihood of Aβ degradation diminishes in favor of Aβ secretion and aggregation. BACE overexpression increases β-cleavage such that little APP is targeted to the axon (green) which precludes synaptic targeting and release of Aβ. The inhibition of Aβ pathology due to BACE overexpression indicates that the subcellular localization of Aβ either alters the aggregation kinetics of Aβ, or alters the stability of the peptide due to the intracellular or extracellular localization of Aβ degrading enzymes. Aβ secreted in the somatodendritic compartment (boxes) remains soluble, whereas that released from synaptic terminals (star bursts) deposits into plaques. Red and green circles indicate transported APP in monogenic APP and bigenic APPxBACE mice.
Similar articles
- Amyloid beta peptide load is correlated with increased beta-secretase activity in sporadic Alzheimer's disease patients.
Li R, Lindholm K, Yang LB, Yue X, Citron M, Yan R, Beach T, Sue L, Sabbagh M, Cai H, Wong P, Price D, Shen Y. Li R, et al. Proc Natl Acad Sci U S A. 2004 Mar 9;101(10):3632-7. doi: 10.1073/pnas.0205689101. Epub 2004 Feb 20. Proc Natl Acad Sci U S A. 2004. PMID: 14978286 Free PMC article. - BACE (beta-secretase) modulates the processing of APLP2 in vivo.
Pastorino L, Ikin AF, Lamprianou S, Vacaresse N, Revelli JP, Platt K, Paganetti P, Mathews PM, Harroch S, Buxbaum JD. Pastorino L, et al. Mol Cell Neurosci. 2004 Apr;25(4):642-9. doi: 10.1016/j.mcn.2003.12.013. Mol Cell Neurosci. 2004. PMID: 15080893 - Neuronal and glial beta-secretase (BACE) protein expression in transgenic Tg2576 mice with amyloid plaque pathology.
Rossner S, Apelt J, Schliebs R, Perez-Polo JR, Bigl V. Rossner S, et al. J Neurosci Res. 2001 Jun 1;64(5):437-46. doi: 10.1002/jnr.1095. J Neurosci Res. 2001. PMID: 11391698 - Alzheimer's disease.
De-Paula VJ, Radanovic M, Diniz BS, Forlenza OV. De-Paula VJ, et al. Subcell Biochem. 2012;65:329-52. doi: 10.1007/978-94-007-5416-4_14. Subcell Biochem. 2012. PMID: 23225010 Review. - Human beta-secretase (BACE) and BACE inhibitors: progress report.
John V. John V. Curr Top Med Chem. 2006;6(6):569-78. doi: 10.2174/156802606776743084. Curr Top Med Chem. 2006. PMID: 16712492 Review.
Cited by
- GGA1 acts as a spatial switch altering amyloid precursor protein trafficking and processing.
von Arnim CA, Spoelgen R, Peltan ID, Deng M, Courchesne S, Koker M, Matsui T, Kowa H, Lichtenthaler SF, Irizarry MC, Hyman BT. von Arnim CA, et al. J Neurosci. 2006 Sep 27;26(39):9913-22. doi: 10.1523/JNEUROSCI.2290-06.2006. J Neurosci. 2006. PMID: 17005855 Free PMC article. - Mechanism of cerebral beta-amyloid angiopathy: murine and cellular models.
Herzig MC, Van Nostrand WE, Jucker M. Herzig MC, et al. Brain Pathol. 2006 Jan;16(1):40-54. doi: 10.1111/j.1750-3639.2006.tb00560.x. Brain Pathol. 2006. PMID: 16612981 Free PMC article. Review. - Increased expression of reticulon 3 in neurons leads to reduced axonal transport of β site amyloid precursor protein-cleaving enzyme 1.
Deng M, He W, Tan Y, Han H, Hu X, Xia K, Zhang Z, Yan R. Deng M, et al. J Biol Chem. 2013 Oct 18;288(42):30236-30245. doi: 10.1074/jbc.M113.480079. Epub 2013 Sep 4. J Biol Chem. 2013. PMID: 24005676 Free PMC article. - Partial BACE1 reduction in a Down syndrome mouse model blocks Alzheimer-related endosomal anomalies and cholinergic neurodegeneration: role of APP-CTF.
Jiang Y, Rigoglioso A, Peterhoff CM, Pawlik M, Sato Y, Bleiwas C, Stavrides P, Smiley JF, Ginsberg SD, Mathews PM, Levy E, Nixon RA. Jiang Y, et al. Neurobiol Aging. 2016 Mar;39:90-8. doi: 10.1016/j.neurobiolaging.2015.11.013. Epub 2015 Dec 2. Neurobiol Aging. 2016. PMID: 26923405 Free PMC article. - Lack of BACE1 S-palmitoylation reduces amyloid burden and mitigates memory deficits in transgenic mouse models of Alzheimer's disease.
Andrew RJ, Fernandez CG, Stanley M, Jiang H, Nguyen P, Rice RC, Buggia-Prévot V, De Rossi P, Vetrivel KS, Lamb R, Argemi A, Allaert ES, Rathbun EM, Krause SV, Wagner SL, Parent AT, Holtzman DM, Thinakaran G. Andrew RJ, et al. Proc Natl Acad Sci U S A. 2017 Nov 7;114(45):E9665-E9674. doi: 10.1073/pnas.1708568114. Epub 2017 Oct 23. Proc Natl Acad Sci U S A. 2017. PMID: 29078331 Free PMC article.
References
- Bodendorf, U., S. Danner, F. Fischer, M. Stefani, C. Sturchler-Pierrat, K.H. Wiederhold, M. Staufenbiel, and P. Paganetti. 2002. Expression of human β-secretase in the mouse brain increases the steady-state level of β-amyloid. J. Neurochem. 80:799–806. - PubMed
- Borchelt, D.R., J. Davis, M. Fischer, M.K. Lee, H.H. Slunt, T. Ratovitsky, J. Regard, N.G. Copeland, N.A. Jenkins, S.S. Sisodia, and D.L. Price. 1996. A vector for expressing foreign genes in the brains and hearts of Tg mice. Genet. Anal. 13:159–163. - PubMed
- Borchelt, D.R., T. Ratovitski, J. van Lare, M.K. Lee, V. Gonzales, N.A. Jenkins, N.G. Copeland, D.L. Price, and S.S. Sisodia. 1997. Accelerated amyloid deposition in the brains of Tg mice coexpressing mutant presenilin 1 and amyloid precursor proteins. Neuron. 19:939–945. - PubMed
Publication types
MeSH terms
Substances
LinkOut - more resources
Full Text Sources
Other Literature Sources
Molecular Biology Databases


