Zinc fingers as protein recognition motifs: structural basis for the GATA-1/friend of GATA interaction - PubMed (original) (raw)
Zinc fingers as protein recognition motifs: structural basis for the GATA-1/friend of GATA interaction
Chu Kong Liew et al. Proc Natl Acad Sci U S A. 2005.
Abstract
GATA-1 and friend of GATA (FOG) are zinc-finger transcription factors that physically interact to play essential roles in erythroid and megakaryocytic development. Several naturally occurring mutations in the GATA-1 gene that alter the FOG-binding domain have been reported. The mutations are associated with familial anemias and thrombocytopenias of differing severity. To elucidate the molecular basis for the GATA-1/FOG interaction, we have determined the three-dimensional structure of a complex comprising the interaction domains of these proteins. The structure reveals how zinc fingers can act as protein recognition motifs. Details of the architecture of the contact domains and their physical properties provide a molecular explanation for how the GATA-1 mutations contribute to distinct but related genetic diseases.
Figures
Fig. 1.
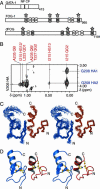
Structure of the GATA/FOG complex. (A) Domain structures of GATA-1, FOG-1, and Drosophila FOG (U-shaped). NF, N-terminal ZnF; CF, C-terminal ZnF. Shaded ZnFs have a CCHC topology, and domains marked with a star can bind NF. Amino acid numbers are also given. (B) Section of a 2D F1-13C-filtered, F2-13C-edited NOESY of the [15N, 13C]dFOG-F1/mNF complex. Intermolecular NOEs between protons from dFOG-F1 (red) and mNF (blue) are shown. Numbering is for the full-length proteins. (C) Stereo diagram of the overlay of the top 20 structures of the GATA-1/FOG complex. mNF is shown in blue and dFOG-F1 is shown in red. (D) Ribbon diagram of the lowest energy structure of the complex. Zinc ions are shown in gray and zinc-ligating side chains are shown in gold and blue.
Fig. 2.
The GATA-1:dFOG interface. Electrostatic surfaces of mNF (Left) and dFOG-F1 (Right) are shown (blue for mNF and red for dFOG-F1). The relative orientations of each image compared with Fig. 1 are indicated.
Fig. 3.
Sequence diversity in GATA-binding FOG ZnFs. (A) The GATA-FOG structure showing the position of A225dFOG (Left), and the likely position of the valine side chain that replaces A225 in a complex formed between NF and mFOG-F6 (Right). (B) Position of the S218 side chain and the two nearby glutamates from NF (Left). (Right) The likely position of the arginine side chain that would replace S218 in a NF/mFOG-F1 complex.
Fig. 4.
Simultaneous binding of GATA-1 to DNA and FOG-1. (A) Pull-down showing that full-length GATA-1 can simultaneously bind to the murine α-globin promoter and recruit full-length FOG-1. MEL cell nuclear extract (lane 1), supplemented with COS nuclear extract from untransfected [COS-(mock); lanes 5 and 6] or transfected [COS(FOG); lanes 3 and 4] cells, was incubated with DNA containing either a wild-type (WT) or a mutant (mut) GATA site coupled to magnetic beads. Complexes were blotted with antibodies against GATA-1 and FOG. (B) Pull-down showing that murine GATA-1 NF can simultaneously bind a GATC site and FOG-1 finger 6. Magnetic beads coupled to a GATC-containing oligonucleotide were incubated with purified MBP-NF and GST-FOG-F6 and run on denaturing gels. Gels were blotted with anti-MBP and anti-GST. A number of breakdown products of GST-FOG-F6 are visible in the input. (C) DNA- and protein-binding surfaces of the GATA/FOG complex. The DNA-binding surface of GATA-1 NF is inferred from the NMR structure of the GATA-1 CF bound to DNA (38). The complex is shown in the same orientation as in Fig. 1_D_.
Fig. 5.
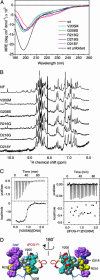
GATA-1 NF mutations associated with familial blood disorders. (A) Far-UV CD spectra of NF mutants, showing that each forms substantial secondary structure, compared to the wild-type protein in the absence of Zn(II) (black). (B) One-dimensional 1H NMR spectra of the proteins in A. V205M, G208S, D218G, and D218Y do not form compact tertiary structures in the same way as the wild-type or R216Q. (C) Isothermal titration calorimetry data showing the titration of dFOG-F1 into V205M (Right) and the titration of V205M into a 16-bp olignonucleotide (Left). (D) Locations of the NF mutations (yellow) in the GATA/FOG complex. The complex is shown in the same orientation as in Fig. 1. The DNA-binding surface of NF is shown in purple, whereas the FOG-binding face is shown in gray. R216 lies on the NF/DNA interface, V205 and G208 lie on the FOG contact surface, and D218 lies between these two opposing surfaces.
Similar articles
- Key residues characteristic of GATA N-fingers are recognized by FOG.
Fox AH, Kowalski K, King GF, Mackay JP, Crossley M. Fox AH, et al. J Biol Chem. 1998 Dec 11;273(50):33595-603. doi: 10.1074/jbc.273.50.33595. J Biol Chem. 1998. PMID: 9837943 - The solution structure of the N-terminal zinc finger of GATA-1 reveals a specific binding face for the transcriptional co-factor FOG.
Kowalski K, Czolij R, King GF, Crossley M, Mackay JP. Kowalski K, et al. J Biomol NMR. 1999 Mar;13(3):249-62. doi: 10.1023/a:1008309602929. J Biomol NMR. 1999. PMID: 10212985 - Transcriptional cofactors of the FOG family interact with GATA proteins by means of multiple zinc fingers.
Fox AH, Liew C, Holmes M, Kowalski K, Mackay J, Crossley M. Fox AH, et al. EMBO J. 1999 May 17;18(10):2812-22. doi: 10.1093/emboj/18.10.2812. EMBO J. 1999. PMID: 10329627 Free PMC article. - Coregulation of GATA factors by the Friend of GATA (FOG) family of multitype zinc finger proteins.
Cantor AB, Orkin SH. Cantor AB, et al. Semin Cell Dev Biol. 2005 Feb;16(1):117-28. doi: 10.1016/j.semcdb.2004.10.006. Epub 2004 Dec 15. Semin Cell Dev Biol. 2005. PMID: 15659346 Review. - GATA-1: friends, brothers, and coworkers.
Morceau F, Schnekenburger M, Dicato M, Diederich M. Morceau F, et al. Ann N Y Acad Sci. 2004 Dec;1030:537-54. doi: 10.1196/annals.1329.064. Ann N Y Acad Sci. 2004. PMID: 15659837 Review.
Cited by
- Genome of Halimeda opuntia reveals differentiation of subgenomes and molecular bases of multinucleation and calcification in algae.
Zhang H, Wang X, Qu M, Yu H, Yin J, Liu X, Liu Y, Zhang B, Zhang Y, Wei Z, Yang F, Wang J, Shi C, Fan G, Sun J, Long L, Hutchins DA, Bowler C, Lin S, Wang D, Lin Q. Zhang H, et al. Proc Natl Acad Sci U S A. 2024 Sep 24;121(39):e2403222121. doi: 10.1073/pnas.2403222121. Epub 2024 Sep 20. Proc Natl Acad Sci U S A. 2024. PMID: 39302967 - Using High-Throughput Measurements to Identify Principles of Transcriptional and Epigenetic Regulators.
DelRosso N, Bintu L. DelRosso N, et al. Methods Mol Biol. 2024;2842:79-101. doi: 10.1007/978-1-0716-4051-7_4. Methods Mol Biol. 2024. PMID: 39012591 - The role of GATA switch in benzene metabolite hydroquinone inhibiting erythroid differentiation in K562 cells.
Yu CH, Yang SQ, Zhang YJ, Rong L, Yi ZC. Yu CH, et al. Arch Toxicol. 2023 Aug;97(8):2169-2181. doi: 10.1007/s00204-023-03541-0. Epub 2023 Jun 17. Arch Toxicol. 2023. PMID: 37329354 - Zinc finger structure determination by NMR: Why zinc fingers can be a handful.
Neuhaus D. Neuhaus D. Prog Nucl Magn Reson Spectrosc. 2022 Jun-Aug;130-131:62-105. doi: 10.1016/j.pnmrs.2022.07.001. Epub 2022 Jul 15. Prog Nucl Magn Reson Spectrosc. 2022. PMID: 36113918 Free PMC article. Review. - Structural basis for interaction between CLAMP and MSL2 proteins involved in the specific recruitment of the dosage compensation complex in Drosophila.
Tikhonova E, Mariasina S, Efimov S, Polshakov V, Maksimenko O, Georgiev P, Bonchuk A. Tikhonova E, et al. Nucleic Acids Res. 2022 Jun 24;50(11):6521-6531. doi: 10.1093/nar/gkac455. Nucleic Acids Res. 2022. PMID: 35648444 Free PMC article.
References
- Weiss, M. J. & Orkin, S. H. (1995) Exp. Hematol. 23, 99-107. - PubMed
- Cantor, A. B. & Orkin, S. H. (2002) Oncogene 21, 3368-3376. - PubMed
- Trainor, C. D., Ghirlando, R. & Simpson, M. A. (2000) J. Biol. Chem. 275, 28157-28166. - PubMed
- Newton, A., Mackay, J. & Crossley, M. (2001) J. Biol. Chem. 276, 35794-35801. - PubMed
Publication types
MeSH terms
Substances
LinkOut - more resources
Full Text Sources
Other Literature Sources
Molecular Biology Databases


