Regulation of gephyrin cluster size and inhibitory synaptic currents on Renshaw cells by motor axon excitatory inputs - PubMed (original) (raw)
Regulation of gephyrin cluster size and inhibitory synaptic currents on Renshaw cells by motor axon excitatory inputs
David Gonzalez-Forero et al. J Neurosci. 2005.
Abstract
Renshaw cells receive a high density of inhibitory synapses characterized by large postsynaptic gephyrin clusters and mixed glycinergic/GABAergic inhibitory currents with large peak amplitudes and long decays. These properties appear adapted to increase inhibitory efficacy over Renshaw cells and mature postnatally by mechanisms that are unknown. We tested the hypothesis that heterosynaptic influences from excitatory motor axon inputs modulate the development of inhibitory synapses on Renshaw cells. Thus, tetanus (TeNT) and botulinum neurotoxin A (BoNT-A) were injected intramuscularly at postnatal day 5 (P5) to, respectively, elevate or reduce motor axon firing activity for approximately 2 weeks. After TeNT injections, the average gephyrin cluster areas on Renshaw cells increased by 18.4% at P15 and 28.4% at P20 and decreased after BoNT-A injections by 17.7% at P15 and 19.9% at P20. The average size differences resulted from changes in the proportions of small and large gephyrin clusters. Whole-cell recordings in P9-P15 Renshaw cells after P5 TeNT injections showed increases in the peak amplitude of glycinergic miniature postsynaptic currents (mPSCs) and the fast component of mixed (glycinergic/GABAergic) mPSCs compared with controls (60.9% and 78.9%, respectively). GABAergic mPSCs increased in peak amplitude to a smaller extent (45.8%). However, because of the comparatively longer decays of synaptic GABAergic currents, total current transfer changes after TeNT were similar for synaptic glycine and GABA(A) receptors (56 vs 48.9% increases, respectively). We concluded that motor axon excitatory synaptic activity modulates the development of inhibitory synapse properties on Renshaw cells, influencing recruitment of postsynaptic gephyrin and glycine receptors and, to lesser extent, GABA(A) receptors.
Figures
Figure 1.
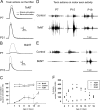
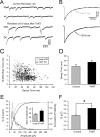
Peripheral actions of TeNT and BoNT-A. A-C, Toxin actions on the NMJ. D-F, Toxin actions on motoneuronal firing recorded by electroneurography of the tibial nerve. A, Representative tension recordings of gastrocnemius muscle contractions in P9 and P21 animals that received injections of 25 ng/kg TeNT after direct (applied to the muscle) and indirect (applied to the tibial nerve) stimulation. Muscle contractions are similar after either stimulation, suggesting unblocked neuromuscular transmission. B, Same as in A, but for P7 and P15 animals that received injections of 30 ng/kg BoNT-A. Profound neuromuscular transmission blockade occurred at P7 (muscle does not contract by stimulating the nerve) that partially recovered at P15. C, Time course of changes in indirect (nerve) to direct (muscle) stimulation tension-evoked ratios after treatment with clostridial neurotoxins. Control data are from the contralateral noninjected side. Two-way ANOVA indicates significant differences between BoNT-A treatment at all time points with respect to the control side (LSD for post hoc comparisons at a significance level of p < 0.05). D, E, Selected epochs of nerve discharge at P7, P15, and P19 in TeNT- and BoNT-A-treated animals in response to stimulation of the tail tip. Motor responses were increased in the TeNT-treated nerve and depressed after BoNT-A. F, Time course of changes in nerve activity responses expressed as a percentage of the control side for the same time interval. Tetanus or depressed firing developed over 2-4 d after treatment. Significant changes occur from P6 to P15 for TeNT and from P6 to P17 for BoNT-A treatment (two-way ANOVA; LSD test for post hoc comparisons; p < 0.05). Sham-operated animals measured at P8 show similar responses in both sides.
Figure 2.
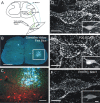
Experimental design and alterations of gephyrin cluster structure on Renshaw cells after TeNT or BoNT-A injections. A, Diagram illustrating the basic circuit between muscle and the spinal cord motor network targeted by peripherally administered clostridial toxins. Toxins and retrograde tracers were injected in the gastrocnemius muscle. BoNT-A affects NMJs at extrafusal and intrafusal muscle fibers, and some enters the retrograde transport toward the spinal cord. TeNT bypasses the NMJ and is retrogradely transported to the cell bodies, where it exerts it effects over inhibitory synapses on the motoneuron (MN) cell somas (see Discussion for details and references). B, Retrograde tracers (Fast Blue and Diamidino Yellow) were injected with each toxin or vehicle to identify spinal cord sections containing large numbers of affected motoneurons. The gastrocnemius motor pool is retrogradely labeled by Fast Blue (motoneuron somata) and Diamidino Yellow (motoneuron large nuclei). C, The region within the white box in D is magnified in C, and calbindin immunoreactivity is added to show Renshaw cells in the vicinity of toxin-treated motoneurons. Renshaw cells in sections containing >10 labeled motoneurons were sampled randomly for analysis from both injected (containing the labeled motoneurons) and contralateral sides (unlabeled, control). D, Confocal reconstruction of the surface of a Renshawcell (RC) from the control side of a P20 animal. The proximal somato dendritic surface is covered with gephyrin clusters of different sizes and shapes, usually larger than clusters on processes of other neurons in the adjacent neuropil. E, F, Similar surface reconstructions of Renshaw cells (RC) from ventral horns containing TeNT-treated (E) or BoNT-A-treated (F) motoneurons. Calbindin immunoreactivity of these Renshaw cells is illustrated in their respective insets (bottom right). Several optical sections were superimposed to render en face views of gephyrin clusters covering the top surfaces of the neurons. All Renshaw cells exhibited large gephyrin clusters that easily distinguished them from other neurons; however, large clusters were more frequent in TeNT-treated Renshaw cells and less after BoNT-A. Scale bars: B, 500 μm; C, 100 μm; D-F, 10 μm; insets, 5 μm.
Figure 3.
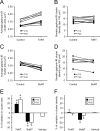
Effects of TeNT and BoNT-A on the development of gephyrin-IR clusters on Renshaw cells. A, B, Plots illustrating average cluster sizes (A) and densities (B) obtained from five P15 (•) and four P20 (○) TeNT-treated animals. Points connected by lines represent the average cluster areas or densities in the control (contralateral) and experimental (ipsilateral) side of the same animal. Cluster sizes and densities increased from P15 to P20. Gephyrin clusters on TeNT-treated Renshaw cells were always larger than on the control side, whereas no change was observed in cluster density. C, D, Sameasin A and B, but for data obtained from four P15 and six P20 (only 3 in D) BoNT-A-treated animals. BoNT-A treatment had opposite effects on the cluster size development. The average cluster area in all of the animals was smaller on the BoNT-A-injected side, whereas cluster density remained unchanged relative to control, except for one P15 animal that was clearly different from the rest. E, F, Analysis of average changes (expressed as a percentage of variation; mean ± SE) in gephyrin cluster area (E) or density (F) on Renshaw cells induced by TeNT and BoNT-A treatments at P15 (▪) and P20 (□). Gephyrin cluster areas significantly increased or declined on the treated side after TeNT or BoNT-A, respectively; cluster density was slightly reduced only in BoNT-A-injected animals. However, this difference was below the statistical significance level (p > 0.05). Asterisks indicate significant differences relative to the contralateral (untreated) side (p < 0.05; paired Student's t test).
Figure 4.
Gephyrin cluster size distributions are changed in opposite directions by TeNT and BoNT-A. A, B, Distribution histograms and cumulative probability functions of gephyrin cluster areas measured on Renshaw cells from five P15 (A) and four P20 (B) TeNT-treated animals. Data were obtained from 42 control (gray lines; n = 2375 clusters) and 42 experimental (black lines; n = 2287 clusters) Renshaw cells (RCs) at P15 (A) and from 55 control (gray lines; n = 4870 clusters) and 54 experimental (black lines; n = 5167 clusters) RCs at P20. B, C, Same as in A and B, but for RCs from BoNT-A-treated animals (n = 4 at P15 and n = 6 at P20). Data are pooled from 45 control (gray lines; n = 2935 clusters) and 51 experimental (black lines; n = 2923 clusters) RCs at P15 (C) and from 55 control (gray lines; n = 4870 clusters) and 53 experimental (black lines; n = 5167 clusters) RCs at P20 (D). Cumulative probability functions were progressively shifted to the right, and the area distributions were skewed toward larger sizes at the ages P15 and P20 after TeNT. In contrast, BoNT-A treatment caused opposite shifts to the right (lower cluster areas) in gephyrin cluster area distributions. All four distributions of gephyrin cluster sizes ipsilateral to the injected side were significantly different from contralateral control distributions (p < 0.05; K-S test). Bin width, 0.05 μm.
Figure 5.
Anatomical characterization of recorded Renshaw cells. A, Selected low-magnification confocal optical planes through a 300-μm-thick slice of a P10 spinal cord containing a neurobiotin-labeled Renshaw cell (streptavidin-Cy3 is shown in white to better display details of its dendrites and axon) and VAChT-IR boutons (green; FITC). This image is from the control side of a TeNT-injected animal. VAChT immunoreactivity is weak inside motoneuron cell somas and very strong in C terminals in lamina IX (LIX) and surrounding Renshaw cells (Alvarez et al., 1999). This Renshaw cell had a profuse local axonal arborization that targeted ventral motor pools. Inset, Varicose axon collaterals from the region labeled with an asterisk in A. The yellow dotted line indicates the gray/white matter border. B, High-magnification image showing a partial reconstruction of the cell soma and dendrites of the Renshaw cell shown in A (white dot). VAChT-IR terminals appear in green. Many VAChT-IR boutons contact the cell soma (bottom left inset; arrows) and dendrites. The boxed dendritic region (bottom right) is shown at higher magnification in the bottom left inset. C, Low magnification of selected optical planes from the TeNT-injected side of a 300-μm-thick P9 spinal cord slice. VAChT-IR boutons appear as small dots in green (FITC). In addition, motoneuron somata containing retrogradely transported FITC-CTb are indicated with arrowheads. In this section, three neurons were recorded and labeled (opencircles indicated the locations of the cell bodies). Cell body images of recorded cells are shown in the insets at the left. The neuron at the top is a motoneuron that also contained FITC-CTb. The neuron at the bottom corresponds to a Renshaw cell shown at higher magnification in D. The cell in the middle did not display VAChT-IR contacts or Renshaw cell characteristics and probably represents another kind of ventral interneuron. The yellow dotted line indicates the gray/white matter border as before. D, High magnification of the Renshaw cell in the TeNT-treated side of the slice shown in C. VAChT-IR contacts are indicated in the cell soma and proximal dendrites (arrows). The density of VAChT-IR contacts increases at some distance from the cell body (boxed dendritic regions shown in the indicated insets). The distribution of VAChT-IR contacts resembles that of adult Renshaw cells (Alvarez et al., 1999). LF, Lateral funiculs; VF, ventral funiculus; LIX, lamina IX. Scale bars: A, C, 200 μm; B, D, insets, 5 μm.
Figure 6.
Inhibitory synaptic currents are upregulated in Renshaw cells located ipsilateral to TeNT injections. A, Traces of spontaneously occurring miniature “inhibitory” PSCs recorded from a P11 Renshaw cell in the control side (top traces) and from a P10 Renshaw cell recorded in the TeNT-injected side 5 d after injection (bottom traces). Neurons were voltage clamped at -75 mV, and mPSCs were isolated with TTX (1 μ
m
), CNQX (10 μ
m
), and
d
-tubocurarine (30 μ
m
). Three different types of mPSCs could be identified: fast decaying (•), slow decaying (○), and mixed events (asterisks). Peak amplitudes of fast and mixed mPSCs were larger in TeNT-treated Renshaw cells. B, Average mPSCs of all of the types of events (fast decaying, slow decaying, and mixed events) from the cells illustrated in A during 5 min of continuous recordings. Decay phases of average mPSCs were always best fitted by double-exponential functions (superimposed dashed lines), in which τf and τs are the decay time constants of the “fast” and “slow” components, and _A_f and _A_s represent the relative contribution of the fast and slow components to the absolute peak amplitude. The averages of current traces in Renshaw cells in the TeNT-treated side (bottom trace) showed a large increase in the peak amplitude of the fast component and a slight slowing of the decay of the slow component. C-F, Histograms showing quantitative comparisons of peak amplitude (C), slow (τs) and fast (τf) decay time constants (D), _A_f/_A_s ratio (E), and charge transferred (F) for averaged mPSCs obtained in control (n = 8) and Renshaw cells in the TeNT-treated side (n = 8). The asterisks indicate significant differences between both groups (p < 0.05; Student's t test). The growth in amplitude of the fast component and the small lengthening of the slow component both significantly contributed to an increase in the charge transferred by the averaged mPSCs in Renshaw cells recorded in the TeNT-treated side.
Figure 7.
Peak amplitude of glycinergic mPSC increases in Renshaw cells after TeNT treatment. A, B, Glycinergic mPSCs recorded in the presence of TTX, CNQX,
d
-tubocurarine, and bicuculline (10 μ
m
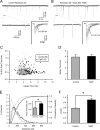
) from control P12 (A) and experimental P9 (B) Renshaw cells recorded 7 and 4 d after TeNT injection, respectively. The bottom traces display at a longer time scales the segments of recordings indicated in the top traces. The insets represent the superimposition of the individual events displayed in the top traces and their average (gray). Decays were well fitted by a single-exponential function to the average traces. The estimated decay time constants (τ) are also indicated. In Renshaw cells recorded in the TeNT-treated side, glycinergic mPSCs increase in peak amplitude without significant changes in the decay time course. C, Relationships between the 10-90% rise time to decay time of individual glycinergic mPSCs recorded from the control (gray dots) and TeNT-treated Renshaw cells (black dots) illustrated in A and B. No correlations were observed between both parameters (r < 0.1). D, Comparison of average (means ± SE) glycinergic mPSC decay times (to 33% of peak amplitude) from control (n = 8) and TeNT-treated Renshaw cells (n = 15). No significant differences (p = 0.80; Student's t test) were found. E, Histogram distribution and cumulative probability functions of glycinergic mPSC amplitudes for the same cells as in D. The amplitude histogram was skewed toward higher values, and the cumulative distributions significantly shifted to the right in the TeNT-treated side (p < 0.05; K-S test). Bin width, 10 pA. Inset, Mean peak amplitude values of glycinergic mPSCs were significantly different in Renshaw cells recorded from the TeNT-treated and control sides. F, Average charge transfer of glycinergic mPSCs in control and experimental Renshaw cells. Large amplitude glycinergic events contribute to a higher transfer of inhibitory charge into Renshaw cells located in the TeNT-treated side. The asterisks in E and F denote significant differences between TeNT-treated and control groups (p < 0.05; Student's t test).
Figure 8.
Variations in the kinetics and amplitude of GABAergic mPSCs after TeNT injections. A, Representative traces from a control P12 Renshaw cell and a TeNT-treated P13 Renshaw cell showing spontaneous isolated GABAergic mPSCs. Note a greater incidence of GABAergic mPSCs of larger amplitude and longer decays in the TeNT-treated side. B, Average current traces of GABAergic mPSCs obtained in the control and experimental Renshaw cells illustrated in A. The decay phase was best fitted with monoexponential functions. The decay time constant and peak amplitude values were somewhat higher in the TeNT-treated Renshaw cell. C, Ten to ninety percent rise time to decay time plots of GABAergic mPSCs obtained from the control (gray dots; n = 327 events) and TeNT-treated Renshaw cells (black dots; n = 320 events) shown in A. No correlations between both parameters were found (r < 0.3). Both distributions widely overlapped. D, Average GABAergic mPSC decay times (mean ± SE) in control (n = 5) and TeNT-treated Renshaw cells (n = 5). TeNT did not affect mean decays of GABAergic mPSCs (p = 0.13; Student's t test). E, Distribution histogram and cumulative probability functions of GABAergic mPSC peak amplitudes for five Renshaw cells recorded in the control side (gray lines; n = 749 events) and Renshaw cells recorded in the TeNT-treated side (black lines; n = 1513 events). Inset, Comparison of mean GABA mPSC peak amplitudes. Although TeNT significantly affected peak amplitude distributions (p < 0.05; K-S test), resulting in a prominent skew toward large amplitude events, statistical differences in their mean values were not reached (p = 0.13; Student's t test). F, Comparison of charge transfer (Q) by averaged GABAergic mPSCs in Renshaw cells recorded from the control and TeNT-treated sides. The combination of changes in amplitude and decay resulted in a significant increase in the charge transferred by GABAergic mPSCs in Renshaw cells located in the TeNT-treated side. The asterisk indicates significant differences (p < 0.05; Student's t test).
Similar articles
- Principles of interneuron development learned from Renshaw cells and the motoneuron recurrent inhibitory circuit.
Alvarez FJ, Benito-Gonzalez A, Siembab VC. Alvarez FJ, et al. Ann N Y Acad Sci. 2013 Mar;1279:22-31. doi: 10.1111/nyas.12084. Ann N Y Acad Sci. 2013. PMID: 23530999 Free PMC article. Review. - Differential postnatal maturation of GABAA, glycine receptor, and mixed synaptic currents in Renshaw cells and ventral spinal interneurons.
González-Forero D, Alvarez FJ. González-Forero D, et al. J Neurosci. 2005 Feb 23;25(8):2010-23. doi: 10.1523/JNEUROSCI.2383-04.2005. J Neurosci. 2005. PMID: 15728841 Free PMC article. - Glycine and GABA(A) receptor subunits on Renshaw cells: relationship with presynaptic neurotransmitters and postsynaptic gephyrin clusters.
Geiman EJ, Zheng W, Fritschy JM, Alvarez FJ. Geiman EJ, et al. J Comp Neurol. 2002 Mar 12;444(3):275-89. doi: 10.1002/cne.10148. J Comp Neurol. 2002. PMID: 11840480 - Synaptic Connectivity between Renshaw Cells and Motoneurons in the Recurrent Inhibitory Circuit of the Spinal Cord.
Moore NJ, Bhumbra GS, Foster JD, Beato M. Moore NJ, et al. J Neurosci. 2015 Oct 7;35(40):13673-86. doi: 10.1523/JNEUROSCI.2541-15.2015. J Neurosci. 2015. PMID: 26446220 Free PMC article. - Gephyrin and the regulation of synaptic strength and dynamics at glycinergic inhibitory synapses.
Alvarez FJ. Alvarez FJ. Brain Res Bull. 2017 Mar;129:50-65. doi: 10.1016/j.brainresbull.2016.09.003. Epub 2016 Sep 6. Brain Res Bull. 2017. PMID: 27612963 Review.
Cited by
- The Expanding Therapeutic Utility of Botulinum Neurotoxins.
Fonfria E, Maignel J, Lezmi S, Martin V, Splevins A, Shubber S, Kalinichev M, Foster K, Picaut P, Krupp J. Fonfria E, et al. Toxins (Basel). 2018 May 18;10(5):208. doi: 10.3390/toxins10050208. Toxins (Basel). 2018. PMID: 29783676 Free PMC article. Review. - Activity-dependent movements of postsynaptic scaffolds at inhibitory synapses.
Hanus C, Ehrensperger MV, Triller A. Hanus C, et al. J Neurosci. 2006 Apr 26;26(17):4586-95. doi: 10.1523/JNEUROSCI.5123-05.2006. J Neurosci. 2006. PMID: 16641238 Free PMC article. - Excitatory and inhibitory intermediate zone interneurons in pathways from feline group I and II afferents: differences in axonal projections and input.
Bannatyne BA, Liu TT, Hammar I, Stecina K, Jankowska E, Maxwell DJ. Bannatyne BA, et al. J Physiol. 2009 Jan 15;587(2):379-99. doi: 10.1113/jphysiol.2008.159129. Epub 2008 Dec 1. J Physiol. 2009. PMID: 19047211 Free PMC article. - Nociception in the Glycine Receptor Deficient Mutant Mouse Spastic.
Groemer TW, Triller A, Zeilhofer HU, Becker K, Eulenburg V, Becker CM. Groemer TW, et al. Front Mol Neurosci. 2022 Apr 25;15:832490. doi: 10.3389/fnmol.2022.832490. eCollection 2022. Front Mol Neurosci. 2022. PMID: 35548669 Free PMC article. - Principles of interneuron development learned from Renshaw cells and the motoneuron recurrent inhibitory circuit.
Alvarez FJ, Benito-Gonzalez A, Siembab VC. Alvarez FJ, et al. Ann N Y Acad Sci. 2013 Mar;1279:22-31. doi: 10.1111/nyas.12084. Ann N Y Acad Sci. 2013. PMID: 23530999 Free PMC article. Review.
References
- Aamodt SM, Shi J, Colonesse MT, Veras W, Constantine-Paton M (2000) Chronic NMDA exposure accelerates development of GABAergic inhibition in the superior colliculus. J Neurophysiol 83: 1580-1591. - PubMed
- Aguado F, Carmona MA, Pozas E, Aguilo A, Martinez-Guijarro FJ, Alcantara S, Borrell V, Yuste R, Ibanez CF, Soriano E (2003) BDNF regulates spontaneous correlated activity at early developmental stages by increasing synaptogenesis and expression of the K+/Cl-co-transporter KCC2. Development 130: 1267-1280. - PubMed
- Alvarez FJ, Dewey DE, Harrington DA, Fyffe REW (1997) Cell-type specific organization of glycine receptor clusters in the mammalian spinal cord. J Comp Neurol 379: 150-170. - PubMed
- Alvarez FJ, González-Forero D, Geiman E, Pastor AM (2004) Gephyrin clustering and postsynaptic glycinergic currents increase in Renshaw cells after enhancing motor axon inputs with tetanus neurotoxin. Soc Neurosci Abstr 30: 838.8.
Publication types
MeSH terms
Substances
LinkOut - more resources
Full Text Sources
Other Literature Sources
Miscellaneous
