A large-scale analysis of mRNA polyadenylation of human and mouse genes - PubMed (original) (raw)
A large-scale analysis of mRNA polyadenylation of human and mouse genes
Bin Tian et al. Nucleic Acids Res. 2005.
Abstract
mRNA polyadenylation is a critical cellular process in eukaryotes. It involves 3' end cleavage of nascent mRNAs and addition of the poly(A) tail, which plays important roles in many aspects of the cellular metabolism of mRNA. The process is controlled by various cis-acting elements surrounding the cleavage site, and their binding factors. In this study, we surveyed genome regions containing cleavage sites [herein called poly(A) sites], for 13,942 human and 11,155 mouse genes. We found that a great proportion of human and mouse genes have alternative polyadenylation ( approximately 54 and 32%, respectively). The conservation of alternative polyadenylation type or polyadenylation configuration between human and mouse orthologs is statistically significant, indicating that alternative polyadenylation is widely employed by these two species to produce alternative gene transcripts. Genes belonging to several functional groups, indicated by their Gene Ontology annotations, are biased with respect to polyadenylation configuration. Many poly(A) sites harbor multiple cleavage sites (51.25% human and 46.97% mouse sites), leading to heterogeneous 3' end formation for transcripts. This implies that the cleavage process of polyadenylation is largely imprecise. Different types of poly(A) sites, with regard to their relative locations in a gene, are found to have distinct nucleotide composition in surrounding genomic regions. This large-scale study provides important insights into the mechanism of polyadenylation in mammalian species and represents a genomic view of the regulation of gene expression by alternative polyadenylation.
Figures
Figure 1
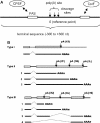
(A) Schematic representation of a poly(A) site and polyadenylation configuration. In this study, a poly(A) site is a region containing cleavage site(s) (arrowed lines). The 5′-most cleavage site is the reference point (position 0) for the poly(A) site. Thus, the genomic location of a poly(A) site is represented by the location of the 5′-most cleavage site it contains. The sequence −300 to +300 is defined as a terminal sequence. The sites for CPSF and CstF are also depicted. (B) Three types of polyadenylation configuration. A type 1 gene has a single poly(A) site; a type II gene has alternative poly(A) sites all located in the 3′-most exon; and a type III gene has alternative poly(A) sites located in different exons. Types of poly(A) sites are also marked. 1S, a single poly(A) site; 2F, the 5′-most poly(A) site in a type II gene; 2L, the 3′-most poly(A) site in a type II gene; 2M, a middle poly(A) site between 2F and 2L in a type II gene; 3U, a poly(A) site located upstream of the 3′-most exon; and 3S, a single site in the 3′-most exon of a type III gene. Not shown in the graph are 3F, 3M and 3L, which are similar to 2F, 2M and 2L, respectively, except that the formers are located in the 3′-most exon of a type III gene. Exons are represented as boxes; pA, poly(A) site.
Figure 2
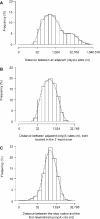
Poly(A) sites of human genes. (A) Histogram of the genomic distance between adjacent poly(A) sites in a gene. (B) Histogram of the distance between adjacent poly(A) sites, both located in the 3′-most exon of a gene (median = 288 nt). (C) Histogram of the distance between the stop codon and its closest downstream poly(A) site (median = 324 nt). The _x_-axes in all graphs are in base-2 logarithmic scale. For each histogram, a Gaussian smoothing kernel method was used to generate a density line.
Figure 3
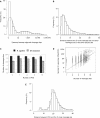
Multiple cleavage sites in a poly(A) site. (A) Histogram of the genomic distance between adjacent cleavage sites in genes. (B) Histogram of the distance between the 5′-most cleavage site and other downstream cleavage sites when multiple cleavage sites are present in a poly(A) site (mean = 7.9 nt, median = 5 nt). (C) The relationship between the number of PAS hexamers (AAUAAA and other 11 variants) associated with a poly(A) site and the number of cleavage sites in the poly(A) site. Error bars are standard error of the mean (SEM). (D) Correlation between the number of cleavage sites and the number of supporting cDNA/EST sequences for poly(A) sites (Pearson correlation coefficient R = 0.83). (E) Histogram of the distance between a poly(A) site and the associated PAS when only one PAS is present. Only human poly(A) sites are used in (A–E).
Figure 4
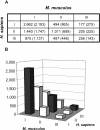
Conservation of polyadenylation configuration between human and mouse orthologs. (A) Conservation of polyadenylation configuration between human (rows) and mouse (columns) orthologs (χ2-test, _P_-value = 2.0 × 10−132). Expected values, based on the null hypothesis that there is no correlation, are shown in parentheses. Observed values in (A) are plotted in (B), with the closed bars corresponding to conserved configurations, i.e. human type I versus mouse type I, etc.
Figure 5
Characteristics of different types of poly(A) sites. (A) Association of various PAS hexamers with different types of poly(A) sites [for detailed definition of nine types of poly(A) sites see Figure 1B and Results]. (B) Cluster analysis of PAS hexamers and poly(A) types. The grayscale heat map represents the percentages of usage of PAS hexamers in different poly(A) types, with the sum of all values for each poly(A) type set to 100%. The shade of a cell indicates its value, with darker ones corresponding to higher values. Two-way hierarchical clustering was conducted using Euclidean distance as the metric. (C) Percentage of the number of supporting cDNA/EST sequences for different types of poly(A) sites. The total number of supporting cDNA/EST sequences for a gene is set to 100%. (D) Distribution of the number of cleavage sites per poly(A) site for different types of poly(A) site. Different shades are used to represent the number of cleavage sites per poly(A) site.
Figure 6
Nucleotide composition of human terminal sequences. Human terminal sequences containing nine types of poly(A) sites are plotted. The poly(A) site type is marked in each graph, and the number of sequences used for each graph is shown in parentheses. The _y_-axis for each graph is the percentage of a nucleotide (%) and the _x_-axis is the genomic location (nt) relative to the poly(A) site. See Figure 1B and Results for detailed definitions of nine poly(A) site types.
Similar articles
- PolyA_DB: a database for mammalian mRNA polyadenylation.
Zhang H, Hu J, Recce M, Tian B. Zhang H, et al. Nucleic Acids Res. 2005 Jan 1;33(Database issue):D116-20. doi: 10.1093/nar/gki055. Nucleic Acids Res. 2005. PMID: 15608159 Free PMC article. - Biased alternative polyadenylation in human tissues.
Zhang H, Lee JY, Tian B. Zhang H, et al. Genome Biol. 2005;6(12):R100. doi: 10.1186/gb-2005-6-12-r100. Epub 2005 Nov 28. Genome Biol. 2005. PMID: 16356263 Free PMC article. - Bioinformatic identification of candidate cis-regulatory elements involved in human mRNA polyadenylation.
Hu J, Lutz CS, Wilusz J, Tian B. Hu J, et al. RNA. 2005 Oct;11(10):1485-93. doi: 10.1261/rna.2107305. Epub 2005 Aug 30. RNA. 2005. PMID: 16131587 Free PMC article. - Implications of polyadenylation in health and disease.
Curinha A, Oliveira Braz S, Pereira-Castro I, Cruz A, Moreira A. Curinha A, et al. Nucleus. 2014;5(6):508-19. doi: 10.4161/nucl.36360. Epub 2014 Oct 31. Nucleus. 2014. PMID: 25484187 Free PMC article. Review. - RNA-binding proteins in regulation of alternative cleavage and polyadenylation.
Zheng D, Tian B. Zheng D, et al. Adv Exp Med Biol. 2014;825:97-127. doi: 10.1007/978-1-4939-1221-6_3. Adv Exp Med Biol. 2014. PMID: 25201104 Review.
Cited by
- Functional analysis of arylamine N-acetyltransferase 1 (NAT1) NAT1*10 haplotypes in a complete NATb mRNA construct.
Millner LM, Doll MA, Stepp MW, States JC, Hein DW. Millner LM, et al. Carcinogenesis. 2012 Feb;33(2):348-55. doi: 10.1093/carcin/bgr273. Epub 2011 Nov 22. Carcinogenesis. 2012. PMID: 22114069 Free PMC article. - Role of RNA structural plasticity in modulating HIV-1 genome packaging and translation.
Yasin S, Lesko SL, Kharytonchyk S, Brown JD, Chaudry I, Geleta SA, Tadzong NF, Zheng MY, Patel HB, Kengni G, Neubert E, Quiambao JMC, Becker G, Ghinger FG, Thapa S, Williams A, Radov MH, Boehlert KX, Hollmann NM, Singh K, Bruce JW, Marchant J, Telesnitsky A, Sherer NM, Summers MF. Yasin S, et al. Proc Natl Acad Sci U S A. 2024 Aug 13;121(33):e2407400121. doi: 10.1073/pnas.2407400121. Epub 2024 Aug 7. Proc Natl Acad Sci U S A. 2024. PMID: 39110735 Free PMC article. - Dynamic expression of 3' UTRs revealed by Poisson hidden Markov modeling of RNA-Seq: implications in gene expression profiling.
Lu J, Bushel PR. Lu J, et al. Gene. 2013 Sep 25;527(2):616-23. doi: 10.1016/j.gene.2013.06.052. Epub 2013 Jul 9. Gene. 2013. PMID: 23845781 Free PMC article. - Transcriptome-wide analyses of CstF64-RNA interactions in global regulation of mRNA alternative polyadenylation.
Yao C, Biesinger J, Wan J, Weng L, Xing Y, Xie X, Shi Y. Yao C, et al. Proc Natl Acad Sci U S A. 2012 Nov 13;109(46):18773-8. doi: 10.1073/pnas.1211101109. Epub 2012 Oct 29. Proc Natl Acad Sci U S A. 2012. PMID: 23112178 Free PMC article. - Deciphering the impact of genetic variation on human polyadenylation using APARENT2.
Linder J, Koplik SE, Kundaje A, Seelig G. Linder J, et al. Genome Biol. 2022 Nov 5;23(1):232. doi: 10.1186/s13059-022-02799-4. Genome Biol. 2022. PMID: 36335397 Free PMC article.
References
- Lewis J.D., Gunderson S.I., Mattaj I.W. The influence of 5′ and 3′ end structures on pre-mRNA metabolism. J. Cell. Sci. Suppl. 1995;19:13–19. - PubMed
- Jacobson A., Peltz S.W. Interrelationships of the pathways of mRNA decay and translation in eukaryotic cells. Annu. Rev. Biochem. 1996;65:693–739. - PubMed
- Wickens M., Anderson P., Jackson R.J. Life and death in the cytoplasm: messages from the 3′ end. Curr. Opin. Genet. Dev. 1997;7:220–232. - PubMed
- Maniatis T., Reed R. An extensive network of coupling among gene expression machines. Nature. 2002;416:499–506. - PubMed
- Proudfoot N. New perspectives on connecting messenger RNA 3′ end formation to transcription. Curr. Opin. Cell. Biol. 2004;16:272–278. - PubMed
Publication types
MeSH terms
Substances
LinkOut - more resources
Full Text Sources
Other Literature Sources


