In vivo modulation of morphogenetic movements in Drosophila embryos with femtosecond laser pulses - PubMed (original) (raw)
In vivo modulation of morphogenetic movements in Drosophila embryos with femtosecond laser pulses
Willy Supatto et al. Proc Natl Acad Sci U S A. 2005.
Abstract
The complex biomechanical events associated with embryo development are investigated in vivo, by using femtosecond laser pulse-induced ablation combined with multimodal nonlinear microscopy. We demonstrate controlled intravital ablations preserving local cytoskeleton dynamics and resulting in the modulation of specific morphogenetic movements in nonmutant Drosophila embryos. A quantitative description of complex movements is obtained both in GFP-expressing systems by using whole-embryo two-photon microscopy and in unlabeled nontransgenic embryos by using third harmonic generation microscopy. This methodology provides insight into the issue of mechano-sensitive gene expression by revealing the correlation of in vivo tissue deformation patterns with Twist protein expression in stomodeal cells at gastrulation.
Figures
Fig. 1.
Femtosecond pulses allow 3D-confined processing of embryo tissue. (a1_–_a4) Illustration of the graded effects induced inside embryos by line scans of increasing pulse energies. (b) Diagram of the effects induced along a 100-μm-long line scan as a function of energy per pulse and pulse density, according to the four graded regimes illustrated in a1_–_a4. Regime 1 (a1, filled triangles) corresponds to no detectable disruption (when monitored by using endogenous 2PEF). Regime 2 (a2, open triangles) corresponds to the appearance of bright fluorescence along the scan, and the onset of microexplosions in the perinuclear region of the cytoplasm. Regime 3 (a3, filled circles) corresponds to the occurring of cavitation bubbles lasting <5 s and creating lesions on the order of cell size (≈5–6 μm). Regime 4 (_a4_, open circles) corresponds to the formation of large bubbles (>5–6 μm) lasting >5 s. Fourteen different embryos were used to generate the diagram, and several points were recorded for each embryo. Gray lines along which the induced effect is constant represent the frontiers between regimes, and α values reflect the dependence of effects on excitation intensity (–1/α being the slope of the line). (c) Transverse view of a wild-type embryo after microdissection performed at the limit between regimes 3 and 4. The area of the vitelline membrane, which was in the path of the ablating beam (between white arrows), is left intact. (Scale bars: 10 μm.) See Movie 1.
Fig. 2.
Ablations induce minimal perturbation to local cytoskeleton dynamics. (a) sGMCA embryo before photoablation. Anterior right, dorsal up. Asterisks indicate the ablation region. (b2 and b3) CFI in an sGMCA embryo near the ablation (photoablated).(c1_–_c3 and d) Control. (c1_–_c3) CFI in an intact sGMCA embryo. (d) Kymograph computed along the apicobasal axis in the rectangle region in c2, on which the slopes at the cellularization front (black lines) directly give the CFI rate. CFI in a control embryo consisted of three phases: a slow phase (SP Left, ≈0.3 μm/min at 19°C), an early fast phase (EFP Center, ≈0.6 μm/min), and a fast phase (FP Right, ≈1 μm/min) after the cellularization front passes above the nuclei (21, 22). (e1 and e2) Kymograph analysis. (e1) CFI rate measured 1 min after ablation (during EFP, solid line) at different distances from the ablated region, and comparison with control embryos (squares, n = 3). (e2) Same measurement 15 min after photoablation (during FP). (Scale bar: 20 μm.)
Fig. 3.
Whole-embryo imaging of morphogenetic movements. (a) 3D reconstruction of the spatial distribution of nuclei within an nls-GFP embryo at stage 5 of development, calculated from a 2PEF XYZT stack. Rotation was through the dorsoventral axis. Fifty-five frames with 2-μm spacing were acquired, revealing the ≈3,000 nuclei of a half-embryo. (b1_–_b3) 4D imaging of a developing nls-GFP embryo. These data are extracted from a sequence of 3D images (b1, 4 min; b2, 20 min; b3, 36 min after the onset of gastrulation) spanning stages 5 to 7 of development, and illustrate major morphogenetic movements of gastrulation such as cephalic furrow formation [between gray arrows, lateral view (Right)] and ventral furrow invagination [white arrows, anterior view (Left)]. The embryo is slightly tilted so that the ventral furrow is visible. (Scale bar: 50 μm.) Total acquisition time: 1 min per 3D image. (See Movie 2.)
Fig. 4.
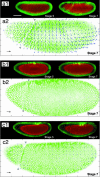
Multiphoton ablation allows quantified modulation of specific morphogenetic movements (a1 and a2, control; b1 and b2, middorsal ablation; c1 and c2, postdorsal ablation). (a1) Development of an intact sGMCA embryo. Green represents images recorded at the equator. Red represents images recorded ≈20 μm under the surface. (b1) Development of a sGMCA embryo after a 100 μm × 40 μm middorsal ablation (see Quantified Modulation of Morphogenetic Movements in Vivo), resulting in disrupted lateral cell movements and no cephalic furrow formation (gray arrowheads). (c1) Development of an sGMCA embryo after a 100 μm × 40 μm postdorsal ablation resulting in disrupted lateral cell movements only. (a2, b2, and c2) Corresponding velocimetric analysis for the same embryos at stage 7. Each experiment was reproduced on five different embryos and gave similar results. (Scale bar: 100 μm.) Black scale arrow, 5 μm/min.
Fig. 5.
Middorsal ablation modulates morphogenetic movements at the anterior pole, which are correlated with Twist expression. (b) Sequence of development at the anterior pole (black square region in a) of control and photoablated sGMCA embryos, showing the disrupted movements of SP cells after middorsal ablation (see Fig. 4_b_). Approximate time after the onset of gastrulation is indicated in minutes (inverted contrast images). (Black scale arrow: 2 μm/min.) (c) Mean velocity of morphogenetic movements occurring in the blue box area in a for both embryos. Velocity fields are projected in the direction perpendicular to the apicobasal axis of SP cells, with the convention of positive velocities toward the posterior pole (see direction arrows). Velocimetric analysis provides a quantitative description of the local modulation of morphogenetic movements resulting from the ablation. In particular, the backward/forward movement of SP tissue is disrupted, which is confirmed by the deformation analysis (divergence) of the velocity field. (d) twist expression pattern at stage 7 in an intact embryo and after middorsal ablation. Femtosecond pulse-induced disruption of SP mechanical deformations is correlated with a decrease of twist expression level in SP cells (between white arrows). Shown are lateral views, with anterior left and dorsal up.
Fig. 6.
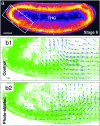
Quantitative description of morphogenetic movements can be obtained in unstained embryos by using THG microscopy. (a) THG equator image of an unlabeled wild-type embryo (1,180-nm excitation). (Scale bar: 50 μm.) (b1 and b2) Velocimetric analysis of morphogenetic movements at the anterior pole in an intact wild-type embryo (b1, control) and a wild-type embryo after middorsal ablation (b2, photoablated) observed in THG microscopy. THG image analysis provides information similar to GFP systems (see Fig. 5) in the nuclei regions, and additional information about internal structures dynamics. Data were recorded at stage 6 of development. (Black scale arrow: 3 μm/min.)
Similar articles
- Tissue deformation modulates twist expression to determine anterior midgut differentiation in Drosophila embryos.
Desprat N, Supatto W, Pouille PA, Beaurepaire E, Farge E. Desprat N, et al. Dev Cell. 2008 Sep;15(3):470-477. doi: 10.1016/j.devcel.2008.07.009. Dev Cell. 2008. PMID: 18804441 - Apoptotic force and tissue dynamics during Drosophila embryogenesis.
Toyama Y, Peralta XG, Wells AR, Kiehart DP, Edwards GS. Toyama Y, et al. Science. 2008 Sep 19;321(5896):1683-6. doi: 10.1126/science.1157052. Science. 2008. PMID: 18802000 Free PMC article. - Probing cell mechanics with subcellular laser dissection of actomyosin networks in the early developing Drosophila embryo.
Rauzi M, Lenne PF. Rauzi M, et al. Methods Mol Biol. 2015;1189:209-18. doi: 10.1007/978-1-4939-1164-6_14. Methods Mol Biol. 2015. PMID: 25245696 - Tension and epithelial morphogenesis in Drosophila early embryos.
Lye CM, Sanson B. Lye CM, et al. Curr Top Dev Biol. 2011;95:145-87. doi: 10.1016/B978-0-12-385065-2.00005-0. Curr Top Dev Biol. 2011. PMID: 21501751 Review. - Interplay of mechanical deformation and patterned gene expression in developing embryos.
Brouzés E, Farge E. Brouzés E, et al. Curr Opin Genet Dev. 2004 Aug;14(4):367-74. doi: 10.1016/j.gde.2004.06.005. Curr Opin Genet Dev. 2004. PMID: 15261652 Review.
Cited by
- Probing Intracellular Dynamics Using Fluorescent Carbon Dots Produced by Femtosecond Laser In Situ.
Astafiev AA, Shakhov AM, Osychenko AA, Syrchina MS, Karmenyan AV, Tochilo UA, Nadtochenko VA. Astafiev AA, et al. ACS Omega. 2020 May 19;5(21):12527-12538. doi: 10.1021/acsomega.0c01535. eCollection 2020 Jun 2. ACS Omega. 2020. PMID: 32548437 Free PMC article. - Central-spindle microtubules are strongly coupled to chromosomes during both anaphase A and anaphase B.
Yu CH, Redemann S, Wu HY, Kiewisz R, Yoo TY, Conway W, Farhadifar R, Müller-Reichert T, Needleman D. Yu CH, et al. Mol Biol Cell. 2019 Sep 1;30(19):2503-2514. doi: 10.1091/mbc.E19-01-0074. Epub 2019 Jul 24. Mol Biol Cell. 2019. PMID: 31339442 Free PMC article. - Gold-nanoparticle-assisted laser perturbation of chromatin assembly reveals unusual aspects of nuclear architecture within living cells.
Mazumder A, Shivashankar GV. Mazumder A, et al. Biophys J. 2007 Sep 15;93(6):2209-16. doi: 10.1529/biophysj.106.102202. Epub 2007 May 11. Biophys J. 2007. PMID: 17496030 Free PMC article. - Multimodal Nonlinear Optical Microscopy.
Yue S, Slipchenko MN, Cheng JX. Yue S, et al. Laser Photon Rev. 2011 Jul;5(4):10.1002/lpor.201000027. doi: 10.1002/lpor.201000027. Laser Photon Rev. 2011. PMID: 24353747 Free PMC article. - Tools to reverse-engineer multicellular systems: case studies using the fruit fly.
Wu Q, Kumar N, Velagala V, Zartman JJ. Wu Q, et al. J Biol Eng. 2019 Apr 23;13:33. doi: 10.1186/s13036-019-0161-8. eCollection 2019. J Biol Eng. 2019. PMID: 31049075 Free PMC article. Review.
References
- Solnica-Krezel, L. & Eaton, S. (2003) Development (Cambridge, U.K.) 130, 4229–4233. - PubMed
- Keller, R., Davidson, L. A. & Shook, D. R. (2003) Differentiation 71, 171–205. - PubMed
- Brouzés, E. & Farge, E. (2004) Curr. Opin. Genet. Dev. 14, 367–374. - PubMed
- Hove, J. R., Köster, R. W., Forouhar, A. S., Acevedo-Bolton, G., Fraser, S. E. & Gharib, M. (2003) Nature 421, 172–177. - PubMed
- Farge, E. (2003) Curr. Biol. 13, 1365–1377. - PubMed
Publication types
MeSH terms
LinkOut - more resources
Full Text Sources
Molecular Biology Databases


