A preferential role for glycolysis in preventing the anoxic depolarization of rat hippocampal area CA1 pyramidal cells - PubMed (original) (raw)
A preferential role for glycolysis in preventing the anoxic depolarization of rat hippocampal area CA1 pyramidal cells
Nicola J Allen et al. J Neurosci. 2005.
Abstract
During brain anoxia or ischemia, a decrease in the level of ATP leads to a sudden decrease in transmembrane ion gradients [anoxic depolarization (AD)]. This releases glutamate by reversing the operation of glutamate transporters, which triggers neuronal death. By whole-cell clamping CA1 pyramidal cells, we investigated the energy stores that delay the occurrence of the AD in hippocampal slices when O2 and glucose are removed. With glycolytic and mitochondrial ATP production blocked in P12 slices, the AD occurred in approximately 7 min at 33 degrees C, reflecting the time needed for metabolic activity to consume the existing ATP and phosphocreatine, and for subsequent ion gradient decrease. Allowing glycolysis fueled by glycogen, in the absence of glucose, delayed the AD by 5.5 min, whereas superfused glucose prevented the AD for >1 h. With glycolysis blocked, the latency to the AD was 6.5 min longer when mitochondria were allowed to function, demonstrating that metabolites downstream of glycolysis (pyruvate, citric acid cycle intermediates, and amino acid oxidation) provide a significant energy store for oxidative phosphorylation. With glycolysis blocked but mitochondria functioning, superfusing lactate did not significantly delay the AD, showing that ATP production from lactate is much less than that from endogenous metabolites. These data demonstrate a preferential role for glycolysis in preventing the AD. They also define a hierarchy of pool sizes for hippocampal energy stores and suggest that brain ATP production from glial lactate may not be significant in conditions of energy deprivation.
Figures
Figure 1.
Schematic diagram of energy production pathways inhibited in this study. Conversion of glucose (or glycogen) to pyruvate by glycolysis generates two ATP molecules and can be inhibited with iodoacetate (IAA). G6P, Glucose-6-phosphate. Pyruvate is converted to acetyl CoA to feed the citric acid cycle, which generates two GTP molecules (convertible to ATP) and exports NADH and FADH2 to the electron transport chain, complexes 1, 3, and 4 (C1, C3, and C4) of which extrude H+ across the mitochondrial membrane to power ATP synthesis (29 ATP/glucose) (Rolfe and Brown, 1997). C1, C3, and C4 can be inhibited with rotenone, antimycin, and cyanide. ATP is used primarily to fuel ion pumping (Attwell and Laughlin, 2001), indicated here as the plasma membrane sodium pump. Short-term ATP reserves occur as phosphocreatine (PCr) and as nucleotide triphosphates (NTP) other than ATP (UTP, GTP, CTP).
Figure 2.
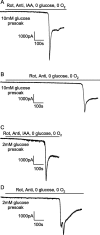
Current response at -33 mV of CA1 pyramidal cells to simulated ischemia. A, B, Slices were presoaked in solution containing 10 m
m
glucose. C, D, Slices were presoaked in solution containing 2 m
m
glucose. A, C, Ischemia simulated by application of 100 μ
m
rotenone (Rot) and 100 μ
m
antimycin (Anti) (to block oxidative phosphorylation) and 2 m
m
iodoacetate (IAA) (to block glycolysis) in oxygen- and glucose-free solution. B, D, Ischemia simulated by application of 100 μ
m
rotenone and 100 μ
m
antimycin (to block oxidative phosphorylation) in oxygen- and glucose-free solution (no iodoacetate present). The cell in D showed a second transient inward current after the AD.
Figure 8.
Glutamate receptor blockers reveal a similar amplitude of glutamate-mediated post-AD plateau current independent of how oxidative phosphorylation is inhibited. A, Application of 25 μ
m
2,3-dihydroxy-6-nitro-7-sulfonyl-benzo[_f_]quinoxaline (NBQX) (to block AMPA receptors) and 50 μ
m
AP-5 (to block NMDA receptors) to the post-AD plateau induced by cyanide (CN) (to block oxidative phosphorylation) and iodoacetate (IAA) (to block glycolysis) in oxygen- and glucose-free solution. B, Application of NBQX and AP-5 to the post-AD plateau current induced by rotenone (Rot) and antimycin (Anti) (to block oxidative phosphorylation) and iodoacetate in oxygen- and glucose-free solution. C, The amplitude of the glutamate-blockable current was not significantly different between the two methods of blocking oxidative phosphorylation. Bold numbers indicate the number of cells studied.
Figure 4.
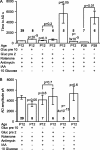
Summary of time taken for the AD to occur and the amplitude of the AD current in the ischemic conditions presented in Figures 2 and 3. A, Time taken for the AD to occur. For the fifth and eighth bars, no AD occurred, and the bar shows the recording duration with no AD. B, Amplitude of the AD current. In both graphs, the numbers in bold represent the number of cells; p values above bars compare values to the first condition [slice presoaked in 10 m
m
glucose; application of solution containing rotenone, antimycin, and iodoacetate (IAA); oxygen and glucose free], whereas p values between bars compare the indicated conditions. Gluc pre 10 or Gluc pre 2, Glucose was present at 10 or 2 m
m
before ischemia. No P28 data are shown for AD amplitude, because in most of these experiments the AD latency was determined solely by extracellular recording.
Figure 3.
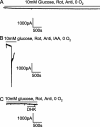
Glycolysis sustained by the presence of 10 m
m
glucose prevented an AD from occurring in the presence of blockers of oxidative phosphorylation. Note the slow time scale compared with the other figures. A, Blocking oxidative phosphorylation [with 100 μ
m
rotenone (Rot) and 100 μ
m
antimycin (Anti)] in oxygen-free solution containing 10 m
m
glucose did not induce an AD after 1 h. B, Repeating the experiment in A but adding 2 m
m
iodoacetate (IAA) to block glycolysis produced an AD as expected after 6 min. C, Blocking the glutamate transporter GLT-1 by application of 200 μ
m
DHK to a slice made ischemic in the same way as in A did not induce an AD.
Figure 5.
O2-sensing ion channels do not affect the time at which the AD occurs. A, An AD occurs in solution containing 100 μ
m
rotenone (Rot), 100 μ
m
antimycin (Anti), and 2 m
m
iodoacetate (IAA) (glucose free; slice presoaked in 10 m
m
glucose) bubbled with O2, just as when the solution was bubbled with N2 (Fig. 2 A). The small steps on the trace are in response to voltage jumps to check series resistance. B, The time of the AD was not affected by the presence of oxygen in the ischemia solution. C, The amplitude of the AD current was reduced when oxygen was present in the ischemia solution. Bold numbers show numbers of cells.
Figure 6.
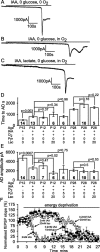
Blocking glycolysis alone is sufficient to induce an AD. _A_-C, Data from P12 slices. A, Blocking glycolysis with 2 m
m
iodoacetate (IAA) in oxygen- and glucose-free solution led to an AD after 8 min. B, Adding oxygen to the solution used in A delayed the AD. C, Adding 5 m
m
lactate to the solution as in B had no effect on the time at which the AD occurred. D, Mean time to the AD in the conditions of _A_-C and with 5 m
m
pyruvate (Pyr) or 20 m
m
lactate (Lac) present for P12 slices and with 0, 5, or 20 m
m
lactate present for P28 slices. E, Mean amplitude of the AD. Bold numbers denote the number of cells studied. F, Decline of the field EPSP initial slope (normalized to value before metabolic inhibition) evoked by 0.1 Hz stimulation of the Schaffer collaterals in the presence (from t = 2 min) of 2 m
m
iodoacetate (and no glucose), 2 m
m
iodoacetate and 20 m
m
lactate, 0.2 m
m
iodoacetate and 10 m
m
glucose (gluc), and 0.2 m
m
iodoacetate and 20 m
m
lactate.
Figure 7.
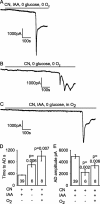
Use of cyanide to block oxidative phosphorylation. A, Ischemia induced by applying oxygen- and glucose-free solution containing 1 m
m
cyanide (CN) (to block oxidative phosphorylation) and 2 m
m
iodoacetate (IAA) (to block glycolysis). B, Omitting iodoacetate when blocking oxidative phosphorylation using cyanide (in oxygen- and glucose-free solution) delayed the time to the AD (this cell showed repeated depolarizing currents after the AD). C, Adding oxygen to glucose-free solution containing 1 m
m
cyanide and 2 m
m
iodoacetate delayed the time to the AD. D, Mean time to the AD in _A_-C. E, Mean amplitude of the AD in _A_-C. Bold numbers show the number of cells studied. p values compare the second and third bars with the first bar in D and E.
Figure 9.
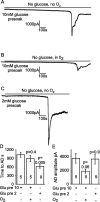
Response of CA1 pyramidal cells to oxygen and glucose deprivation without metabolic blockers. A, Application of oxygen- and glucose-free solution to a pyramidal cell in a slice that had been presoaked in 10 m
m
glucose induced an AD after ∼18 min. B, Applying glucose-free solution in the presence of oxygen induced an AD at a time not significantly different from when oxygen was absent. C, Oxygen and glucose deprivation in a slice that had been presoaked in 2 m
m
glucose solution led to an earlier AD. D, Mean time to AD. E, Mean amplitude of the AD current. Bold numbers indicate the number of cells studied. p values compare the second and third bars with the first bar in D and E. Gluc pre 10 or Glu pre 2, Glucose was present at 10 or 2 m
m
before ischemia.
Similar articles
- Knocking out the glial glutamate transporter GLT-1 reduces glutamate uptake but does not affect hippocampal glutamate dynamics in early simulated ischaemia.
Hamann M, Rossi DJ, Marie H, Attwell D. Hamann M, et al. Eur J Neurosci. 2002 Jan;15(2):308-14. doi: 10.1046/j.0953-816x.2001.01861.x. Eur J Neurosci. 2002. PMID: 11849297 - Anaerobic glycolysis is crucial for the maintenance of neural activity in guinea pig hippocampal slices.
Yamane K, Yokono K, Okada Y. Yamane K, et al. J Neurosci Methods. 2000 Nov 30;103(2):163-71. doi: 10.1016/s0165-0270(00)00312-5. J Neurosci Methods. 2000. PMID: 11084209 - Energy metabolism in astrocytes: high rate of oxidative metabolism and spatiotemporal dependence on glycolysis/glycogenolysis.
Hertz L, Peng L, Dienel GA. Hertz L, et al. J Cereb Blood Flow Metab. 2007 Feb;27(2):219-49. doi: 10.1038/sj.jcbfm.9600343. Epub 2006 Jul 12. J Cereb Blood Flow Metab. 2007. PMID: 16835632 Review. - Cellular mechanisms of brain energy metabolism and their relevance to functional brain imaging.
Magistretti PJ, Pellerin L. Magistretti PJ, et al. Philos Trans R Soc Lond B Biol Sci. 1999 Jul 29;354(1387):1155-63. doi: 10.1098/rstb.1999.0471. Philos Trans R Soc Lond B Biol Sci. 1999. PMID: 10466143 Free PMC article. Review.
Cited by
- Inhibition of high-voltage-activated calcium currents by acute hypoxia in cultured retinal ganglion cells.
Dumanska H, Telka M, Veselovsky N. Dumanska H, et al. Front Cell Neurosci. 2023 Jul 3;17:1202083. doi: 10.3389/fncel.2023.1202083. eCollection 2023. Front Cell Neurosci. 2023. PMID: 37465211 Free PMC article. - Resveratrol Preconditioning Protects Against Ischemia-Induced Synaptic Dysfunction and Cofilin Hyperactivation in the Mouse Hippocampal Slice.
Escobar I, Xu J, Jackson CW, Stegelmann SD, Fagerli EA, Dave KR, Perez-Pinzon MA. Escobar I, et al. Neurotherapeutics. 2023 Jul;20(4):1177-1197. doi: 10.1007/s13311-023-01386-0. Epub 2023 May 19. Neurotherapeutics. 2023. PMID: 37208551 Free PMC article. - Transforming a neural circuit to function without oxygen and glucose delivery.
Bueschke N, Amaral-Silva LD, Adams S, Santin JM. Bueschke N, et al. Curr Biol. 2021 Dec 20;31(24):R1564-R1565. doi: 10.1016/j.cub.2021.11.003. Curr Biol. 2021. PMID: 34932961 Free PMC article. - Astrocyte Gliotransmission in the Regulation of Systemic Metabolism.
Murat CB, García-Cáceres C. Murat CB, et al. Metabolites. 2021 Oct 26;11(11):732. doi: 10.3390/metabo11110732. Metabolites. 2021. PMID: 34822390 Free PMC article. Review. - Energy matters: presynaptic metabolism and the maintenance of synaptic transmission.
Li S, Sheng ZH. Li S, et al. Nat Rev Neurosci. 2022 Jan;23(1):4-22. doi: 10.1038/s41583-021-00535-8. Epub 2021 Nov 15. Nat Rev Neurosci. 2022. PMID: 34782781 Review.
References
- Ames III A (1992) Energy requirements of CNS cells as related to their function and to their vulnerability to ischemia: a commentary based on studies on retina. Can J Physiol Pharmacol [Suppl] 70: S158-S164. - PubMed
- Arden SR, Sinor JD, Potthof WK, Aizenman E (1998) Subunit-specific interactions of cyanide with the N-methyl-d-aspartate receptor. J Biol Chem 273: 21505-21511. - PubMed
- Attwell D, Laughlin SB (2001) An energy budget for signaling in the grey matter of the brain. J Cereb Blood Flow Metab 21: 1133-1145. - PubMed
Publication types
MeSH terms
Substances
LinkOut - more resources
Full Text Sources
Miscellaneous

