Role of viral factor E3L in modified vaccinia virus ankara infection of human HeLa Cells: regulation of the virus life cycle and identification of differentially expressed host genes - PubMed (original) (raw)
Role of viral factor E3L in modified vaccinia virus ankara infection of human HeLa Cells: regulation of the virus life cycle and identification of differentially expressed host genes
Holger Ludwig et al. J Virol. 2005 Feb.
Abstract
Modified vaccinia virus Ankara (MVA) is a highly attenuated virus strain being developed as a vaccine for delivery of viral and recombinant antigens. The MVA genome lacks functional copies of numerous genes interfering with host response to infection. The interferon resistance gene E3L encodes one important viral immune defense factor still made by MVA. Here we demonstrate an essential role of E3L to allow for completion of the MVA molecular life cycle upon infection of human HeLa cells. A deletion mutant virus, MVA-DeltaE3L, was found defective in late protein synthesis, viral late transcription, and viral DNA replication in infected HeLa cells. Moreover, we detected viral early and continuing intermediate transcription associated with degradation of rRNA, indicating rapid activation of 2'-5'-oligoadenylate synthetase/RNase L in the absence of E3L. Further molecular monitoring of E3L function by microarray analysis of host cell transcription in MVA- or MVA-DeltaE3L-infected HeLa cells revealed an overall significant down regulation of more than 50% of cellular transcripts expressed under mock conditions already at 5 h after infection, with a more prominent shutoff following MVA-DeltaE3L infection. Interestingly, a cluster of genes up regulated exclusively in MVA-DeltaE3L-infected cells could be identified, including transcripts for interleukin 6, growth arrest and DNA damage-inducible protein beta, and dual-specificity protein phosphatases. Our data indicate that lack of E3L inhibits MVA antigen production in human HeLa cells at the level of viral late gene expression and suggest that E3L can prevent activation of additional host factors possibly affecting the MVA molecular life cycle.
Figures
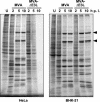
FIG. 1.
Characterization of viral polypeptide synthesis. HeLa and BHK-21 cells (as indicated) were either mock infected (U) or infected with MVA or MVA-ΔE3L at an MOI of 20 and labeled with [35S]methionine for 30 min at the indicated h p.i. Cytoplasmatic extracts were separated by SDS-10% PAGE and analyzed by autoradiography. Typical viral late polypeptides are indicated by arrowheads.
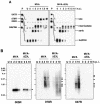
FIG. 2.
Analysis of viral mRNA synthesis. (A) For RPA, HeLa cells were mock infected (U) or infected with MVA or MVA-ΔE3L at an MOI of 20. Total RNA was isolated at 0, 1, 2, 3, 4, 7.5, and 10 h p.i. Probes specific for viral genes 005R, 078R, and 047R were used, representing typical early, intermediate, and late vaccinia virus transcripts, respectively. To monitor cellular transcription activity, a probe specific for GAPDH was used. After RNase digestion, the protected biotin-labeled probe fragments were analyzed by polyacrylamide urea gel electrophoresis followed by detection via a chemiluminescent hybridization and detection kit (PIERCE). Lane P represents probes without RNase digestion. (B) Northern blot analysis of 005R, 078R, and 047R transcripts. Total RNA was isolated at the indicated time points and electrophoretically separated in 1% agarose formaldehyde gels by applying 1 μg of total RNA per lane. Subsequently, RNA was transferred onto a positively charged nylon membrane (Roche Diagnostics) via vacuum blotting and hybridized to riboprobes specific for 005R, 078R, and 047R, respectively. Sizes (in kilobases) of the RNA standards are shown at the left. Detected RNA species are indicated by arrowheads.
FIG. 3.
Comparison of viral DNA synthesis following MVA and MVA-ΔE3L infection. DNA isolated from HeLa cells at 0, 2, 4, and 8 h after infection with MVA or MVA-ΔE3L at an MOI of 10 was immobilized on a positively charged nylon membrane. A DIG-labeled MVA-specific riboprobe was used for hybridization, and chemiluminescence was detected and quantified with a LumiImager (Roche Diagnostics).
FIG. 4.
Activation of RNase L in MVA-ΔE3L-infected cells. HeLa cells were mock infected (U) or infected with MVA or MVA-ΔE3L at an MOI of 20. Total RNA was isolated at 0, 1, 2, 3, 4, 7.5, and 10 h p.i., and 5 μg of total RNA per lane was applied for electrophoresis in a 1% agarose formaldehyde gel. For visualization of rRNA species the gel was stained with ethidium bromide (2 μg/ml). The arrows indicate bands corresponding to characteristic degradation products of rRNA.
FIG. 5.
General effect of MVA and MVA-ΔE3L infection on host cell transcription activity. (A) For box plot analysis, all (22,000) probe sets present on Affymetrix GeneChip human genome U133A were included. The average signal intensities determined as log 2 values for uninfected cells (U) and MVA (M)- and MVA-ΔE3L (Δ)-infected cells at 2.5 and 5 h p.i. (as indicated) are presented with the median and the 50th percentiles in the form of boxes, signifying that 50% of all probe sets are represented within the box. The whiskers extend to the most extreme data points which are no more than 1.5 times the interquartile range from the box. (B) Northern blot analysis for validation of general transcriptional down regulation detected by microarray analysis. Total RNA was isolated from mock-infected (U)- and MVA (M)- and MVA-ΔE3L (ΔE3L)-infected cells at 2.5 and 5 h p.i. and electrophoretically separated in 1% agarose formaldehyde gels by applying 1 μg of total RNA per lane. Subsequently, RNA was transferred onto a positively charged nylon membrane (Roche Diagnostics). Transcripts encoding general transcription factor IIH (GTFIIH4) and cytidine deaminase (CDA) were detected by using DIG-labeled riboprobes specific for respective genes. Results of hybridization and detection by chemiluminescence are shown at the bottom of each panel. Average microarray signal intensities (Array data) of probe sets with the corresponding Affymetrix probe set designations are shown in bar charts.
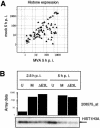
FIG. 6.
Effect of MVA infection on histone transcription. (A) Scatter plot of all histone genes monitored by Affymetrix microarray. Normalized signal intensities of histone probe sets from mock- and MVA-infected HeLa cells at 5 h p.i. are shown. (B) Regulation of histone mRNA level. HeLa cells were mock infected (U) or infected with MVA (M) or MVA-ΔE3L (ΔE3L), and total RNA was isolated at 2.5 and 5 h p.i. RNA was electrophoretically separated in 1% agarose formaldehyde gels by applying 1 μg of total RNA per lane. Transcripts encoding H3 histone family member A (HIST1H3A) were detected by using a DIG-labeled riboprobe specific for HIST1H3A gene, as indicated by the arrow. Average microarray signal intensities (Array data) of corresponding probe set 208575_at are shown as a bar chart with a logarithmic scale.
FIG. 7.
Identification of E3L-dependent differentially expressed host genes. (A) For box plot analysis 1,102 probe sets differentially expressed between MVA- and MVA-ΔE3L-infected cells were included. The average signal intensities determined as log 2 values for uninfected cells (U) and MVA (M)- and MVA-ΔE3L (Δ)-infected cells are presented with the median and the 50th percentiles as the box, signifying that 50% of differentially expressed probe sets are represented within the box. The whiskers extend to the most extreme data point which is no more than 1.5 times the interquartile range from the box. (B) Cluster 1, including genes induced in the absence of E3L during MVA infection of HeLa cells. For _K_-means cluster analysis, 1,102 probe sets were included, which were identified as significantly regulated in comparisons of MVA and MVA-ΔE3L infection. For clustering log 2 data, severalfold change values compared to mock-infection results were used. Cluster 1 of 10 is shown, representing genes with signal intensities following MVA-ΔE3L infection higher than those seen with MVA infection. The color scale symbolizes up (red) or down (green) regulation of the indicated genes. (C) Northern blot analysis for validation of microarray data. HeLa cells were mock infected (U) or infected with MVA (M) or MVA-ΔE3L (ΔE3L), and total RNA was isolated at 2.5 and 5 h p.i. RNA was electrophoretically separated in 1% agarose formaldehyde gels by applying 1 μg of total RNA per lane. Subsequently, RNA was transferred onto a positively charged nylon membrane (Roche Diagnostics). Transcripts encoding ATF3 and IL-6 were detected by using DIG-labeled riboprobes specific for the respective genes. Results of hybridization and detection by chemiluminescence are shown at the bottom of each panel. Average microarray signal intensities (Array data) of respective probe sets with corresponding Affymetrix probe set ID are shown in bar charts.
Similar articles
- Loss of protein kinase PKR expression in human HeLa cells complements the vaccinia virus E3L deletion mutant phenotype by restoration of viral protein synthesis.
Zhang P, Jacobs BL, Samuel CE. Zhang P, et al. J Virol. 2008 Jan;82(2):840-8. doi: 10.1128/JVI.01891-07. Epub 2007 Oct 24. J Virol. 2008. PMID: 17959656 Free PMC article. - Replication of modified vaccinia virus Ankara in primary chicken embryo fibroblasts requires expression of the interferon resistance gene E3L.
Hornemann S, Harlin O, Staib C, Kisling S, Erfle V, Kaspers B, Häcker G, Sutter G. Hornemann S, et al. J Virol. 2003 Aug;77(15):8394-407. doi: 10.1128/jvi.77.15.8394-8407.2003. J Virol. 2003. PMID: 12857909 Free PMC article. - Double-stranded RNA-binding protein E3 controls translation of viral intermediate RNA, marking an essential step in the life cycle of modified vaccinia virus Ankara.
Ludwig H, Suezer Y, Waibler Z, Kalinke U, Schnierle BS, Sutter G. Ludwig H, et al. J Gen Virol. 2006 May;87(Pt 5):1145-1155. doi: 10.1099/vir.0.81623-0. J Gen Virol. 2006. PMID: 16603515 - Modified Vaccinia virus Ankara: innate immune activation and induction of cellular signalling.
Price PJ, Torres-Domínguez LE, Brandmüller C, Sutter G, Lehmann MH. Price PJ, et al. Vaccine. 2013 Sep 6;31(39):4231-4. doi: 10.1016/j.vaccine.2013.03.017. Epub 2013 Mar 21. Vaccine. 2013. PMID: 23523404 Review. - [Modified vaccinia virus ankara (MVA)--development as recombinant vaccine and prospects for use in veterinary medicine].
Volz A, Fux R, Langenmayer MC, Sutter G. Volz A, et al. Berl Munch Tierarztl Wochenschr. 2015 Nov-Dec;128(11-12):464-72. Berl Munch Tierarztl Wochenschr. 2015. PMID: 26697713 Review. German.
Cited by
- Suppression of proinflammatory signal transduction and gene expression by the dual nucleic acid binding domains of the vaccinia virus E3L proteins.
Langland JO, Kash JC, Carter V, Thomas MJ, Katze MG, Jacobs BL. Langland JO, et al. J Virol. 2006 Oct;80(20):10083-95. doi: 10.1128/JVI.00607-06. J Virol. 2006. PMID: 17005686 Free PMC article. - An overview of the vaccinia virus infectome: a survey of the proteins of the poxvirus-infected cell.
Chou W, Ngo T, Gershon PD. Chou W, et al. J Virol. 2012 Feb;86(3):1487-99. doi: 10.1128/JVI.06084-11. Epub 2011 Nov 16. J Virol. 2012. PMID: 22090131 Free PMC article. Review. - Battle Royale: Innate Recognition of Poxviruses and Viral Immune Evasion.
Yu H, Bruneau RC, Brennan G, Rothenburg S. Yu H, et al. Biomedicines. 2021 Jul 1;9(7):765. doi: 10.3390/biomedicines9070765. Biomedicines. 2021. PMID: 34356829 Free PMC article. Review. - Loss of protein kinase PKR expression in human HeLa cells complements the vaccinia virus E3L deletion mutant phenotype by restoration of viral protein synthesis.
Zhang P, Jacobs BL, Samuel CE. Zhang P, et al. J Virol. 2008 Jan;82(2):840-8. doi: 10.1128/JVI.01891-07. Epub 2007 Oct 24. J Virol. 2008. PMID: 17959656 Free PMC article. - Viruses as vaccine vectors for infectious diseases and cancer.
Draper SJ, Heeney JL. Draper SJ, et al. Nat Rev Microbiol. 2010 Jan;8(1):62-73. doi: 10.1038/nrmicro2240. Nat Rev Microbiol. 2010. PMID: 19966816 Review.
References
- Andrade, A. A., P. N. G. Silva, A. C. T. C. Pereira, L. P. de Sousa, P. C. P. Ferreira, R. T. Gazzinelli, E. G. Kroon, C. Ropert, and C. A. Bonjardim. 2004. The vaccinia virus-stimulated mitogen-activated protein kinase (MAPK) pathway is required for virus multiplication. Biochem. J. 381(Pt. 2):437-446. - PMC - PubMed
- Antoine, G., F. Scheiflinger, F. Dorner, and F. G. Falkner. 1998. The complete genomic sequence of the modified vaccinia Ankara strain: comparison with other orthopoxviruses. Virology 244:365-396. - PubMed
- Bablanian, R., S. Scribani, and M. Esteban. 1993. Amplification of polyadenylated nontranslated small RNA sequences (POLADS) during superinfection correlates with the inhibition of viral and cellular protein synthesis. Cell. Mol. Biol. Res. 39:243-255. - PubMed
- Beattie, E., E. B. Kauffman, H. Martinez, M. E. Perkus, B. L. Jacobs, E. Paoletti, and J. Tartaglia. 1996. Host-range restriction of vaccinia virus E3L-specific deletion mutants. Virus Genes 12:89-94. - PubMed
Publication types
MeSH terms
Substances
LinkOut - more resources
Full Text Sources
Other Literature Sources


