MMTV Env encodes an ITAM responsible for transformation of mammary epithelial cells in three-dimensional culture - PubMed (original) (raw)
MMTV Env encodes an ITAM responsible for transformation of mammary epithelial cells in three-dimensional culture
Elad Katz et al. J Exp Med. 2005.
Abstract
Expression of immunoreceptor tyrosine-based activation motif (ITAM)-containing signaling proteins is normally restricted to hematopoietic tissues. The basal activity of ITAM-containing proteins is mediated through negative regulation by coreceptors restricted to hematopoietic tissues. We have identified an ITAM signaling domain encoded within the env gene of murine mammary tumor virus (MMTV). Three-dimensional structures derived in vitro from murine cells stably transfected with MMTV env display a depolarized morphology in comparison with control mammary epithelial cells. This effect is abolished by Y>F substitution within the Env ITAM, as well as inhibitors of Syk and Src protein tyrosine kinases. Env-expressing cells bear hallmarks of cell transformation such as sensitivity to apoptosis induced by tumor necrosis factor (TNF)-related apoptosis-inducing ligand (TRAIL) or TNFalpha, as well as down-regulation of E-cadherin and Keratin-18. Human normal mammary epithelial cells expressing MMTV Env also develop transformed phenotype, as typified by growth in soft agar and Matrigel invasion. These disruptions are abrogated by Y>F substitutions. We conclude that ITAM-dependent signals are generated through MMTV Env and trigger early hallmarks of transformation of mouse and human mammary epithelial cells. Therefore, these data suggest a heretofore unappreciated potential mechanism for the initiation of breast cancer and identify MMTV Env and ITAM-containing proteins in human breast tumors as probable oncoproteins.
Figures
Figure 1.
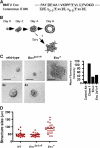
The contribution of ITAM domain in MMTV Env to cell transformation. (A) Schematic comparison of the ITAM in MMTV Env and consensus ITAM sequence. The conserved residues are shaded. (B) Development of mammary epithelial cell acinar structures on Matrigel. The depolarization resulting from MMTV Env expression may lead to loss of the spherical structures. (C) Representative images of three-dimensional cultures of wild-type (WT), mutated (Y422>F, Y432>F) envelope-transfected, envelope-transfected, and MMTV+ NMuMG clone 1 NMuMG cells are shown at day 6 of culture. For WT and F6, the images are also shown at a magnification of 4 of the originals. Note the polarized structures with hollow lumen in both cell types. Bars, 50 μm. (D) Quantification of structure size in a representative experiment (20–60 structures counted for each cell line). The black bars represent the median for each culture. Surface expression of MMTV SU (gp52) is shown for mutated (Y422>F, Y432>F) Env+ and Env+ NMuMG cells. Normal goat IgG was used as the control antibody.
Figure 2.
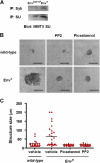
The involvement of Src and Syk kinases in MMTV Env-induced cell transformation. (A) MMTV SU coprecipitates with Syk in a tyrosine-dependent manner. Env2xY>F and Env+ two-dimensional cultures were treated with sodium pervanadate and equal protein loads were used for MMTV SU or Syk immunoprecipitation. A Western blot for MMTV SU is shown. Syk coprecipitates only with Env, but not the 2xY>F mutant (top). (B) Wild-type and Env+ cultures were treated three dimensionally before imaging (at day 6) with either normal assay media, the Src kinase inhibitor PP2 (500 ng/ml), or the Syk kinase inhibitor Piceatannol (500 ng/ml). Bars, 50 μm. (C) Quantification of structure size in a representative experiment (20–60 structures counted for each cell line). The black bars represent the median for each culture.
Figure 3.
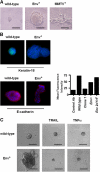
Expression of MMTV Env in murine mammary epithelial cells is sufficient for cell transformation. (A) Representative images of three-dimensional cultures, on Matrigel cushions, of wild-type and Env+ NMuMG cells are shown at day 6 of culture. Bars, 50 μm. (B) Keratin-18 staining of mock-transfected, Env+, and MMTV clone 1 NMuMG cultures at day 6. Keratin-18 is in green and nuclear staining (DAPI) is in blue. (right) E-cadherin surface expression, as quantified by flow cytometry, is reduced in Env+ and MMTV clone 1 NMuMG two-dimensional cultures. (C) Wild-type and Env+ cultures were treated 17 h before imaging (at day 6) with either normal assay media, 1 μg/ml TRAIL, or 100 nM TNFα. The induction of apoptosis was confirmed by TUNEL assays (not depicted).
Figure 4.
MMTV Env also transforms human mammary epithelial cells. (A) Colony formation assay for wild-type, mutated (Y422>F, Y432>F) Env+ and Env+ MCF-10F cells. Colonies were defined as cell clusters >60 μm in size. (right) The percentage of colonies formed in five agar-methocel cultures in a representative experiment out of three independent experiments. (B) Representative images from collagen-matrix cultures of wild-type, mutated Env+, and Env+ MCF-10F cell lines (a representative experiment out of three independent experiments). Ductal structures are visible in wild-type cultures. Complete loss of ductal structure could be seen in Env+ cultures, whereas mutated Env+ culture exhibit a mixed phenotype. (C) Representative images from invasion assays of wild-type, mutated Env+, and Env+ MCF-10F cells. The three panels on the left are showing the stained mesh after the completion of the invasion assays. Invading cells were visualized by blue stain. The right panel shows total invading cell counts from a representative experiment (in duplicate) out of three independent experiments.
Figure 5.
MMTV envelope sequence, domains, and topological models. (A) Schematic representation of MMTV Env protein and its domains. Potential transmembrane domains are numbered and depicted in diagonally striped boxes. The ITAM region is marked in a shaded box. (B) Models for the surface expression of mature MMTV Env on the host cell surface. The domains are marked as in A. The hydrophobicity scores for the transmembrane domains were as follows: 1, 1,489; 2, 699; 3, 2,658; and 4, 3,134.
Similar articles
- An immunoreceptor tyrosine activation motif in the mouse mammary tumor virus envelope protein plays a role in virus-induced mammary tumors.
Ross SR, Schmidt JW, Katz E, Cappelli L, Hultine S, Gimotty P, Monroe JG. Ross SR, et al. J Virol. 2006 Sep;80(18):9000-8. doi: 10.1128/JVI.00788-06. J Virol. 2006. PMID: 16940512 Free PMC article. - Mouse mammary tumor virus suppresses apoptosis of mammary epithelial cells through ITAM-mediated signaling.
Kim HH, Grande SM, Monroe JG, Ross SR. Kim HH, et al. J Virol. 2012 Dec;86(24):13232-40. doi: 10.1128/JVI.02029-12. Epub 2012 Sep 26. J Virol. 2012. PMID: 23015704 Free PMC article. - Cellular ITAM-containing proteins are oncoproteins in nonhematopoietic cells.
Grande SM, Katz E, Crowley JE, Bernardini MS, Ross SR, Monroe JG. Grande SM, et al. Oncogene. 2006 May 4;25(19):2748-57. doi: 10.1038/sj.onc.1209296. Oncogene. 2006. PMID: 16369490 - MMTV-induced mammary tumorigenesis: gene discovery, progression to malignancy and cellular pathways.
Callahan R, Smith GH. Callahan R, et al. Oncogene. 2000 Feb 21;19(8):992-1001. doi: 10.1038/sj.onc.1203276. Oncogene. 2000. PMID: 10713682 Review. - Stem cells and mammary cancer in mice.
Smith GH. Smith GH. Stem Cell Rev. 2005;1(3):215-23. doi: 10.1385/SCR:1:3:215. Stem Cell Rev. 2005. PMID: 17142858 Review.
Cited by
- SYK expression in human breast cancer.
Elkak A, Al Sarakbi W, Mokbel K. Elkak A, et al. J Carcinog. 2005 Apr 20;4(1):7. doi: 10.1186/1477-3163-4-7. J Carcinog. 2005. PMID: 15842733 Free PMC article. - Nucleolar trafficking of the mouse mammary tumor virus gag protein induced by interaction with ribosomal protein L9.
Beyer AR, Bann DV, Rice B, Pultz IS, Kane M, Goff SP, Golovkina TV, Parent LJ. Beyer AR, et al. J Virol. 2013 Jan;87(2):1069-82. doi: 10.1128/JVI.02463-12. Epub 2012 Nov 7. J Virol. 2013. PMID: 23135726 Free PMC article. - A human MMTV-like betaretrovirus linked to breast cancer has been present in humans at least since the copper age.
Lessi F, Grandi N, Mazzanti CM, Civita P, Scatena C, Aretini P, Bandiera P, Fornaciari A, Giuffra V, Fornaciari G, Naccarato AG, Tramontano E, Bevilacqua G. Lessi F, et al. Aging (Albany NY). 2020 Jul 31;12(16):15978-15994. doi: 10.18632/aging.103780. Epub 2020 Jul 31. Aging (Albany NY). 2020. PMID: 32735554 Free PMC article. - Emerging Role of Migration and Invasion Enhancer 1 (MIEN1) in Cancer Progression and Metastasis.
Kushwaha PP, Gupta S, Singh AK, Kumar S. Kushwaha PP, et al. Front Oncol. 2019 Sep 4;9:868. doi: 10.3389/fonc.2019.00868. eCollection 2019. Front Oncol. 2019. PMID: 31552186 Free PMC article. Review. - Role of the immunoreceptor tyrosine-based activation motif of latent membrane protein 2A (LMP2A) in Epstein-Barr virus LMP2A-induced cell transformation.
Fukuda M, Kawaguchi Y. Fukuda M, et al. J Virol. 2014 May;88(9):5189-94. doi: 10.1128/JVI.03714-13. Epub 2014 Feb 19. J Virol. 2014. PMID: 24554661 Free PMC article.
References
- Harder, T., and K.R. Engelhardt. 2004. Membrane domains in lymphocytes—from lipid rafts to protein scaffolds. Traffic. 5:265–275. - PubMed
- Fuentes-Panana, E.M., G. Bannish, and J.G. Monroe. 2004. Basal B-cell receptor signaling in B lymphocytes: mechanisms of regulation and role in positive selection, differentiation, and peripheral survival. Immunol. Rev. 197:26–40. - PubMed
- Fuentes-Panana, E.M., G. Bannish, N. Shah, and J.G. Monroe. 2004. Basal Igalpha/Igbeta signals trigger the coordinated initiation of pre-B cell antigen receptor-dependent processes. J. Immunol. 173:1000–1011. - PubMed
- Monroe, J.G. 2004. Ligand-independent tonic signaling in B-cell receptor function. Curr. Opin. Immunol. 16:288–295. - PubMed
Publication types
MeSH terms
Substances
Grants and funding
- R01 CA087609/CA/NCI NIH HHS/United States
- P01 CA093615/CA/NCI NIH HHS/United States
- R01-CA073746/CA/NCI NIH HHS/United States
- R01-AI43620/AI/NIAID NIH HHS/United States
- P01 AI043620/AI/NIAID NIH HHS/United States
- R01-CA087609/CA/NCI NIH HHS/United States
- P01-CA093615/CA/NCI NIH HHS/United States
- R01 CA073746/CA/NCI NIH HHS/United States
LinkOut - more resources
Full Text Sources
Other Literature Sources
Medical
Miscellaneous


