Regulating intracellular antiviral defense and permissiveness to hepatitis C virus RNA replication through a cellular RNA helicase, RIG-I - PubMed (original) (raw)
Regulating intracellular antiviral defense and permissiveness to hepatitis C virus RNA replication through a cellular RNA helicase, RIG-I
Rhea Sumpter Jr et al. J Virol. 2005 Mar.
Abstract
Virus-responsive signaling pathways that induce alpha/beta interferon production and engage intracellular immune defenses influence the outcome of many viral infections. The processes that trigger these defenses and their effect upon host permissiveness for specific viral pathogens are not well understood. We show that structured hepatitis C virus (HCV) genomic RNA activates interferon regulatory factor 3 (IRF3), thereby inducing interferon in cultured cells. This response is absent in cells selected for permissiveness for HCV RNA replication. Studies including genetic complementation revealed that permissiveness is due to mutational inactivation of RIG-I, an interferon-inducible cellular DExD/H box RNA helicase. Its helicase domain binds HCV RNA and transduces the activation signal for IRF3 by its caspase recruiting domain homolog. RIG-I is thus a pathogen receptor that regulates cellular permissiveness to HCV replication and, as an interferon-responsive gene, may play a key role in interferon-based therapies for the treatment of HCV infection.
Figures
FIG. 1.
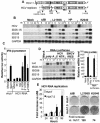
The host response and cellular permissiveness to HCV RNA replication. (A) Diagram of the HCV genome (upper) and related replicon (lower). The polyprotein coding region and positions of individual protein products are shown. Arrows indicate positions of the RNA motifs described in the present study, including the IRES within the 5′NTR. (B) Huh7 cells were mock transfected or transfected with the indicated HCV replicon RNA and harvested 3, 8, 12, or 24 h later. ISG, replicon (HCV), and glyceraldehyde-3-phosphate dehydrogenase (GAPDH) transcript abundance was monitored by Northern blot analysis. (C) Huh7 cells were transfected with an IFN-β promoter-luc construct and 24 h later were mock treated (mock), infected with SenV, or transfected with the indicated RNA. Cells were harvested 20 h after virus infection or 8 h after RNA transfection and then assayed for firefly luciferase activity. Bars show the average values and standard deviation (SD) of firefly luciferase activity relative to a Renilla luciferase control from three experiments (relative luc activity). (D) In the left panel is shown RNA abundance in Huh7 cells that were mock transfected (mock) or transfected with luc-poly(A), HCV 5′NTR-luc, or encephalomyocarditis virus IRES-luc RNA were assessed by Northern blot with probes specific to the indicated ISGs or GAPDH. Cells were harvested at the time shown in hours above each lane, and transfected RNA was detected with a luciferase-specific probe (Luc). For the right panel, cells were mock transfected or transfected with purified L2198S HCV replicon RNA, luc-poly(A), or HCV 5′NTR-luc transcript and then harvested 12 h later. mRNA levels were quantified by real-time PCR. Bars show the average level ± the SD of IFN-β mRNA relative to GAPDH control from three experiments. (E) HCV RNA replication and cellular G418 resistance transduction efficiency were evaluated after transfection of Δ5B or HP replicon RNAs into Huh7 or Huh7.5 cells. On the left is shown the average fold increase ± the SD of HP replicon RNA relative to Δ5B replicon RNA at the indicated times. The replicon abundance was estimated from the luciferase activity expressed by a firefly luciferase sequence that was inserted in lieu of the Neo sequence in the replicon shown in Fig. 1A. This provides an accurate assessment of HCV RNA abundance (28). On the right, G418-resistant colony-forming efficiency of the indicated HCV replicon RNAs was determined by cell staining 3 weeks after transfection of Huh7 (panels 1 to 3) or Huh7.5 cells (panels 4 to 6) followed by G418 selection. The numbers at the bottom show the fold increase in numbers of Huh7.5 cell colonies compared to Huh7 colonies. The results shown are representative of three independent experiments.
FIG. 2.
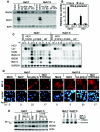
Cells highly permissive to HCV RNA replication have a defective host response. (A) Huh7 and Huh7.5 cells were mock treated (mock), infected with SenV for 20 h (SenV), treated with 10 or 50 U of IFN-α2a/ml for 12 h, or transfected with luc-poly(A) or 5′NTR-luc RNA (HCV) for 8 h. Extracts were subjected to immunoblot analysis for ISG56, SenV, and β-actin abundance. (B) The activity of a transfected IFN-β promoter expression constructs was measured in cells that were mock infected or infected with SenV for 24 h or VSV for 10 h. The results shown are the average firefly luciferase activity ± the SD relative to a Renilla luciferase control. (C) Huh7 and Huh7.5 cells were mock transfected or transfected with 5′NTR-luc, L2198S, or HP HCV replicon RNA. Total cellular RNA was collected at 3, 8, or 12 h, and the level of replicon (HCV), 2′-5′ oligoadenylate synthetase 1 (OAS1), ISG6-16, ISG56, ISG15, and GAPDH RNA as determined by using specific probes. 5′NTR-luc RNA was monitored by using the Luc probe. (D) Huh7 and Huh7.5 cells were mock treated (mock), infected with SenV for 24 h, or transfected with luc-poly(A) (poly A) or HCV 5′NTR-luc RNA (HCV 5′NTR) for 8 h. Cells were processed and stained with anti-IRF3 rabbit serum and a rhodamine-conjugated secondary antibody (panels 1 to 8). Nuclei were visualized by staining with DAPI (panels 9 to 16). Magnification, ×40. The transfection efficiency was monitored by a parallel assessment of luciferase activity; the unit activity values are shown below the corresponding panels. (E) In the left panel, IRF3, ISG56, and actin abundance were evaluated by immunoblot analysis of extracts from untreated Huh7 and Huh7.5 cells or cells treated with 10 U of IFNα-2a/ml for 12 h (IFN) or transfected with HCV 5′NTR-luc RNA for 0, 4, or 8 h. The line at left denotes the position of the high-mass hyperphosphorylated IRF3 isoforms. On the right, proteins were separated on a nondenaturing gel in order to define the abundance of the inactive IRF3 monomer and the active IRF3 dimer complex (indicated at right) in cells that were mock infected or infected with SenV for 20 h.
FIG. 3.
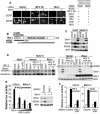
RIG-I is an essential transducer of IRF3 activation. (A) Huh7.5 cells were subjected to complementation analysis with cotransfected plasmids encoding the IRF3-dependent F3-EGFP reporter construct and the constitutively expressed dsRed protein with a vector control plasmid or a plasmid from a panel of constructs encoding proteins implicated in antiviral signaling, including IRF3 5D (positive control), RIG-I (32), TBK1, IKKɛ (6, 23), TRIF (30), and RIP2 (13). At 24 h posttransfection the cells were mock infected (−) or infected with SenV (+). On the left, cells were transfected with RIG-I or control constructs and visualized by direct fluorescence imaging of EGFP and dsRED after mock or SenV infection. A summary of results from this particular analysis is shown on the right; “−” and “+” indicate the absence or presence of EGFP expression. (B) RIG-I structural features. The regions comprising the N-RIG and C-RIG constructs are shown. The RIG-I expression constructs used in the present study contained an amino-terminal FLAG epitope tag fused in frame to the RIG-I coding region. (C) The abundance of SenV proteins, endogenous RIG-I, ISG56, and β-actin was determined by immunoblot analysis of Huh7 and Huh7.5 cells that were mock treated, treated with 10 U of IFN-α2a/ml, or infected with SenV for 20 h. (D) On the left, IRF3 dimer and monomer abundance in nontransfected Huh7 cells or Huh7.5 cells transfected with either empty vector or a vector expressing RIG-I. Cells were mock treated, infected with SenV for 20 h, or transfected with HCV 5′NTR-luc RNA for 4 or 8 h prior to harvest and electrophoresis of extracts through a nondenaturing gel. The positions of the IRF3 monomer and dimer complex are indicated. On the right is shown ISG56, SenV, ectopically expressed RIG-I, and β-actin abundance in extracts from Huh7.5 cells transfected with empty vector or vector encoding RIG-I. At 24 h after transfection, cells were mock treated, infected with SenV for 20 h, or transfected with HCV 5′NTR-luc for 0, 6, 9, or 12 h prior to harvesting for immunoblot analysis. Ectopically expressed RIG-I was detected by using anti-FLAG M2 antibody. (E and F**)** Huh7 cells transfected with IFN-β-luc or ISG56-luc promoter expression constructs were transfected with a control siRNA (control) or a specific siRNA directed to the first exon of RIG-I (RIG-I si265), after which cells were mock infected or infected with SenV for 20 h, followed by quantification of relative luc activity. Bars show the average ± the SD values from triplicate experiments. In panel E, the left panel shows cells transfected with increasing amounts of RIG-I si265 siRNA. The right panel set shows endogenous RIG-I, ISG56, and actin protein abundance in extracts of mock-infected (−) or SenV-infected (+) cells transfected with control or RIG-I si265 siRNA.
FIG. 4.
Characterization of RIG-I function. (A) Extracts from Huh7 cells that were transfected with empty vector or a vector expressing RIG-I were mixed with pIC-coupled agarose beads. The input proteins and those recovered as pull-down products (PD) were evaluated by immunoblot analysis with anti-FLAG (to detect plasmid-encoded RIG-I), anti-PKR, or anti-β-actin antibodies. (B) Extracts from Huh7 cells transfected with the RIG-I expression vector were mixed with pIC-coupled agarose beads, and the binding reactions were supplemented with 10 or 50 μg of soluble pIC, HCV ss1, 5′NTR, or 3′NTR RNA/ml. Input proteins and pull-down products (PD) were evaluated by immunoblot analysis with anti-FLAG and anti-β-actin antibodies. Competitive inhibition of pIC binding to RIG-I was quantified by densitometry and expressed as the percentage of the initial RIG-I pull-down signal remaining in each respective lane. (C) Comparison of the nucleotide sequences of RIG-I mRNA present in Huh7 and Huh7.5 cells demonstrates a C-to-T substitution at nucleotide position 164 in the RIG-I ORF in Huh7.5 cells. This changes codon 55 from threonine to isoleucine (T55I) as shown in the structural diagram. (D) In the left panel, Huh7 cells were cotransfected with IFN-β-luc expression plasmid and 50 ng of vector only (vector) or IFN-β-luc expression plasmid with (from left to right) increasing amounts (25, 50, and 100 ng) of expression vector encoding RIG-I, the full-length T55I mutant (T55I), N-RIG, N-RIG containing the T55I mutation (N-T55I), or full-length T55I mutant with 50 ng of RIG-I expression vector (T55I + RIG-I). Cells were mock infected or infected with SenV for 20 h, harvested, and subjected to luciferase assay. Bars show the average value ± the SD of each relative luciferase activity. In the right panel, Huh7.5 cells were transfected with vector control or plasmids encoding IRF3-5D (control), RIG-I, N-RIG, full-length T55I mutant (T55I), or N-T55I. After 24 h cells were mock infected (−) or infected with SenV (+) for 20 h and then harvested, and extracts were subjected to immunoblot analysis for ISG56, SenV, RIG-I, N-RIG, N-T55I, and β-actin. RIG-I proteins were detected with anti-FLAG antibody. (E) Huh7 cells were transfected with empty vector or vectors encoding RIG-I, C-RIG, or the full-length T55I mutant (T55I). Cells were harvested at 24 h, and extracts were mixed with agarose beads coupled to poly(C) or pIC. Proteins in the pull-down fraction (PD) and input were subjected to immunoblot analysis. RIG-I proteins were detected as in panel B.
FIG. 5.
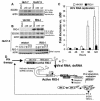
Effect of RIG-I on cellular permissiveness for HCV RNA replication. (A) Huh7 and Huh7.5 cells were mock transfected or transfected with Δ5B or HP HCV replicon RNA. After 24 h, the cells were harvested and extracts were subjected to immunoblot for ISG56 and β-actin. (B) Huh7.5 cells were transfected with vector alone or a vector encoding RIG-I. In the upper panel the cells were secondarily transfected, 24 h later, with Δ5B or the HP replicon RNA. After 24 h, cells were harvested, and extracts were subjected to immunoblot analysis for β-actin, ISG56, and the ectopically expressed RIG-I protein. The lower panel shows an immunoblot analysis of β-actin and ectopic RIG-I protein abundance over a 144-h time course posttransfection. (C) Huh7.5 cells were transfected with empty vector (vector) or vector expressing RIG-I. At 24 h, parallel cultures were secondarily transfected with Δ5B or HP HCV replicon RNA containing the firefly luciferase sequence in lieu of Neo, as described in the legend for Fig. 1E. The level of HCV replicon-encoded luciferase activity was measured as a specific marker of HCV RNA abundance (28). The bars show the average fold increase in luciferase expression ± the SD compared to that expressed by the replication-defective Δ5B replicon control. (D) Model of viral RNA binding and IRF3 signaling by RIG-I. Details are given in the text.
Similar articles
- Regulation of innate antiviral defenses through a shared repressor domain in RIG-I and LGP2.
Saito T, Hirai R, Loo YM, Owen D, Johnson CL, Sinha SC, Akira S, Fujita T, Gale M Jr. Saito T, et al. Proc Natl Acad Sci U S A. 2007 Jan 9;104(2):582-7. doi: 10.1073/pnas.0606699104. Epub 2006 Dec 26. Proc Natl Acad Sci U S A. 2007. PMID: 17190814 Free PMC article. - DDX60L Is an Interferon-Stimulated Gene Product Restricting Hepatitis C Virus Replication in Cell Culture.
Grünvogel O, Esser-Nobis K, Reustle A, Schult P, Müller B, Metz P, Trippler M, Windisch MP, Frese M, Binder M, Fackler O, Bartenschlager R, Ruggieri A, Lohmann V. Grünvogel O, et al. J Virol. 2015 Oct;89(20):10548-68. doi: 10.1128/JVI.01297-15. Epub 2015 Aug 12. J Virol. 2015. PMID: 26269178 Free PMC article. - Hepatitis C virus escape from the interferon regulatory factor 3 pathway by a passive and active evasion strategy.
Binder M, Kochs G, Bartenschlager R, Lohmann V. Binder M, et al. Hepatology. 2007 Nov;46(5):1365-74. doi: 10.1002/hep.21829. Hepatology. 2007. PMID: 17668876 - Hepatitis A and hepatitis C viruses: divergent infection outcomes marked by similarities in induction and evasion of interferon responses.
Qu L, Lemon SM. Qu L, et al. Semin Liver Dis. 2010 Nov;30(4):319-32. doi: 10.1055/s-0030-1267534. Epub 2010 Oct 19. Semin Liver Dis. 2010. PMID: 20960373 Review. - [Virus-induced expression of type I interferon genes].
Yoneyama M, Fujita T. Yoneyama M, et al. Uirusu. 2004 Dec;54(2):161-7. doi: 10.2222/jsv.54.161. Uirusu. 2004. PMID: 15745153 Review. Japanese.
Cited by
- Viral genome imaging of hepatitis C virus to probe heterogeneous viral infection and responses to antiviral therapies.
Ramanan V, Trehan K, Ong ML, Luna JM, Hoffmann HH, Espiritu C, Sheahan TP, Chandrasekar H, Schwartz RE, Christine KS, Rice CM, van Oudenaarden A, Bhatia SN. Ramanan V, et al. Virology. 2016 Jul;494:236-47. doi: 10.1016/j.virol.2016.04.020. Epub 2016 Apr 27. Virology. 2016. PMID: 27128351 Free PMC article. - Innate immune tolerance and the role of kupffer cells in differential responses to interferon therapy among patients with HCV genotype 1 infection.
Lau DT, Negash A, Chen J, Crochet N, Sinha M, Zhang Y, Guedj J, Holder S, Saito T, Lemon SM, Luxon BA, Perelson AS, Gale M Jr. Lau DT, et al. Gastroenterology. 2013 Feb;144(2):402-413.e12. doi: 10.1053/j.gastro.2012.10.044. Epub 2012 Nov 2. Gastroenterology. 2013. PMID: 23123437 Free PMC article. - IFITM1 is a tight junction protein that inhibits hepatitis C virus entry.
Wilkins C, Woodward J, Lau DT, Barnes A, Joyce M, McFarlane N, McKeating JA, Tyrrell DL, Gale M Jr. Wilkins C, et al. Hepatology. 2013 Feb;57(2):461-9. doi: 10.1002/hep.26066. Epub 2012 Dec 12. Hepatology. 2013. PMID: 22996292 Free PMC article. - Generation of hepatitis C virus-resistant liver cells by genome editing-mediated stable expression of RNA aptamer.
Kim TH, Lee SW. Kim TH, et al. Mol Ther Methods Clin Dev. 2023 Nov 7;31:101151. doi: 10.1016/j.omtm.2023.101151. eCollection 2023 Dec 14. Mol Ther Methods Clin Dev. 2023. PMID: 38027068 Free PMC article. - Efficient Suppression of Hepatitis C Virus Replication by Combination Treatment with miR-122 Antagonism and Direct-acting Antivirals in Cell Culture Systems.
Liu F, Shimakami T, Murai K, Shirasaki T, Funaki M, Honda M, Murakami S, Yi M, Tang H, Kaneko S. Liu F, et al. Sci Rep. 2016 Aug 3;6:30939. doi: 10.1038/srep30939. Sci Rep. 2016. PMID: 27484655 Free PMC article.
References
- Bartenschlager, R., and V. Lohmann. 2001. Novel cell culture systems for the hepatitis C virus. Antivir. Res. 52:1-17. - PubMed
- Edelmann, K. H., S. Richardson-Burns, L. Alexopoulou, K. L. Tyler, R. A. Flavell, and M. B. Oldstone. 2004. Does Toll-like receptor 3 play a biological role in virus infections? Virology 322:231-238. - PubMed
Publication types
MeSH terms
Substances
Grants and funding
- AI060389/AI/NIAID NIH HHS/United States
- R01 AI060389/AI/NIAID NIH HHS/United States
- T32-GM08203/GM/NIGMS NIH HHS/United States
- AI48235/AI/NIAID NIH HHS/United States
- U19 AI040035/AI/NIAID NIH HHS/United States
- T32 AI007520/AI/NIAID NIH HHS/United States
- T32 AI 07520/AI/NIAID NIH HHS/United States
- U01 AI048235/AI/NIAID NIH HHS/United States
- R56 AI060389/AI/NIAID NIH HHS/United States
- U19-AI40035/AI/NIAID NIH HHS/United States
- T32 GM008203/GM/NIGMS NIH HHS/United States
LinkOut - more resources
Full Text Sources
Other Literature Sources
Molecular Biology Databases
Research Materials


