Normal modes for predicting protein motions: a comprehensive database assessment and associated Web tool - PubMed (original) (raw)
Normal modes for predicting protein motions: a comprehensive database assessment and associated Web tool
Vadim Alexandrov et al. Protein Sci. 2005 Mar.
Abstract
We carry out an extensive statistical study of the applicability of normal modes to the prediction of mobile regions in proteins. In particular, we assess the degree to which the observed motions found in a comprehensive data set of 377 nonredundant motions can be modeled by a single normal-mode vibration. We describe each motion in our data set by vectors connecting corresponding atoms in two crystallographically known conformations. We then measure the geometric overlap of these motion vectors with the displacement vectors of the lowest-frequency mode, for one of the conformations. Our study suggests that the lowest mode contains useful information about the parts of a protein that move most (i.e., have the largest amplitudes) and about the direction of this movement. Based on our findings, we developed a Web tool for motion prediction (available from http://molmovdb.org/nma) and apply it here to four representative motions--from bacteriorhodopsin, calmodulin, insulin, and T7 RNA polymerase.
Figures
Figure 1.
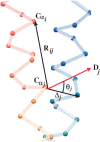
Notations used in the paper. Rij is the vector connecting atom i to atom j in the experimental (initial) structure. Δ_j_ is the difference vector between atom i in the displaced (final) structure and the same atom in the initial structure. Dj is the lowest normal mode displacement vector for atom j in the initial conformation. θ_j_ is the angle between vectors Dj and Δ_j_ for atom j.
Figure 2.
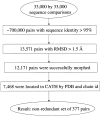
An illustration of the scheme that was used to identify the data set of nonredundant domain motions.
Figure 3.
Distribution of RMSD scores (in Å) for the nonredundant set of domain motions.
Figure 4.
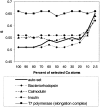
Histogram of S_2 statistic and the corresponding average θ_j angle. Values are shown for 100% (dotted), 10% (dashed), and 2.5% (solid) of selected Cα-atoms based on the motion amplitudes in the nonredundant data set of domain motions. Selection of the most moving atoms results in larger values of _S_2 (the larger values of S and S_2 correspond to the lower average angle between the two sets of vectors). Dotted line points to the location of equal to 54.7°, the average angle between two randomly θ_j generated vectors.
Figure 5.
_S_-statistic as a function of percentage of the largest selected Cα displacements for single-domain and multidomain protein motions.
Figure 6.
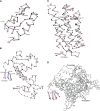
Real motion (red) and NMA-predicted (blue) vectors for the motion of (A) insulin (d7insb_SCOP domain), (B) calmodulin (d2bbm_domain), (C) bacteriorhodopsin (d1c8sa_SCOP domain), and (D) T7 polymerase (elongation complex). In D, labels 1, 2 , 3, and 4 represent residues THR 596, VAL 597, THR 598, and GLY 603, respectively. Arrows indicate only the directions of the motion.
Figure 7.
Histogram of the average angle between the lowest-frequency normal mode vectors and the corresponding observed displacement vectors for the selected Cα with the largest B-factors in the nonredundant data set of domain motions. θ4(B) distribution is represented by the solid line, and θ1(B) by the dashed line.
Figure 8.
Screenshot of the NMA motion and flexibility prediction server: (A) input page and (B) results page.
Similar articles
- Normal mode analysis of macromolecular motions in a database framework: developing mode concentration as a useful classifying statistic.
Krebs WG, Alexandrov V, Wilson CA, Echols N, Yu H, Gerstein M. Krebs WG, et al. Proteins. 2002 Sep 1;48(4):682-95. doi: 10.1002/prot.10168. Proteins. 2002. PMID: 12211036 - WEBnm@: a web application for normal mode analyses of proteins.
Hollup SM, Salensminde G, Reuter N. Hollup SM, et al. BMC Bioinformatics. 2005 Mar 11;6:52. doi: 10.1186/1471-2105-6-52. BMC Bioinformatics. 2005. PMID: 15762993 Free PMC article. - ElNemo: a normal mode web server for protein movement analysis and the generation of templates for molecular replacement.
Suhre K, Sanejouand YH. Suhre K, et al. Nucleic Acids Res. 2004 Jul 1;32(Web Server issue):W610-4. doi: 10.1093/nar/gkh368. Nucleic Acids Res. 2004. PMID: 15215461 Free PMC article. - The Database of Macromolecular Motions: new features added at the decade mark.
Flores S, Echols N, Milburn D, Hespenheide B, Keating K, Lu J, Wells S, Yu EZ, Thorpe M, Gerstein M. Flores S, et al. Nucleic Acids Res. 2006 Jan 1;34(Database issue):D296-301. doi: 10.1093/nar/gkj046. Nucleic Acids Res. 2006. PMID: 16381870 Free PMC article. - A database of macromolecular motions.
Gerstein M, Krebs W. Gerstein M, et al. Nucleic Acids Res. 1998 Sep 15;26(18):4280-90. doi: 10.1093/nar/26.18.4280. Nucleic Acids Res. 1998. PMID: 9722650 Free PMC article.
Cited by
- N-terminal myristoylation alters the calcium binding pathways in neuronal calcium sensor-1.
Chandra K, Ramakrishnan V, Sharma Y, Chary KV. Chandra K, et al. J Biol Inorg Chem. 2011 Jan;16(1):81-95. doi: 10.1007/s00775-010-0705-3. Epub 2010 Sep 21. J Biol Inorg Chem. 2011. PMID: 20857168 - PLA2-like proteins myotoxic mechanism: a dynamic model description.
Borges RJ, Lemke N, Fontes MRM. Borges RJ, et al. Sci Rep. 2017 Nov 14;7(1):15514. doi: 10.1038/s41598-017-15614-z. Sci Rep. 2017. PMID: 29138410 Free PMC article. - Characterization and Prediction of Protein Flexibility Based on Structural Alphabets.
Dong Q, Wang K, Liu B, Liu X. Dong Q, et al. Biomed Res Int. 2016;2016:4628025. doi: 10.1155/2016/4628025. Epub 2016 Aug 30. Biomed Res Int. 2016. PMID: 27660756 Free PMC article. - Bending-Twisting Motions and Main Interactions in Nucleoplasmin Nuclear Import.
Geraldo MT, Takeda AA, Braz AS, Lemke N. Geraldo MT, et al. PLoS One. 2016 Jun 3;11(6):e0157162. doi: 10.1371/journal.pone.0157162. eCollection 2016. PLoS One. 2016. PMID: 27258022 Free PMC article. - "Conformational dynamics of C1r inhibitor proteins from Lyme disease and relapsing fever spirochetes".
Roy S, Booth CE Jr, Powell-Pierce AD, Schulz AM, Skare JT, Garcia BL. Roy S, et al. bioRxiv [Preprint]. 2023 Mar 1:2023.03.01.530473. doi: 10.1101/2023.03.01.530473. bioRxiv. 2023. PMID: 36909632 Free PMC article. Updated. Preprint.
References
- Ahn, J.S., Kanematsu, Y., and Kushida, T. 1993. Site-selective fluorescence spectroscopy in dye-doped polymers. I. Determination of the site-energy distribution and the single-site fluorescence spectrum. Phys. Rev. B Condens. Matter 48 9058–9065. - PubMed
- Alden, R., Schneebeck, M., Ondrias, M., Courtney, S., and Friedman, J. 1992. Mode-specific relaxation dynamics of photoexcited Fe(II) protoporphyrin IX in hemoglobin. J. Raman Spectrosc. 23 569–574.
- Amadei, A., Linssen, A.B., and Berendsen, H.J. 1993. Essential dynamics of proteins. Proteins 17 412–425. - PubMed
- Arfken, G.B. and Weber, H. 2000. Mathematical methods for physicists. Academic Press, New York.
Publication types
MeSH terms
Substances
LinkOut - more resources
Full Text Sources


