Derivation of 2 categories of plasmacytoid dendritic cells in murine bone marrow - PubMed (original) (raw)
Derivation of 2 categories of plasmacytoid dendritic cells in murine bone marrow
Rosana Pelayo et al. Blood. 2005.
Abstract
Plasmacytoid dendritic cells (pDCs) competent to make type I interferon were rigorously defined as a Ly-6C(+) and CD11c(Lo) subset of the B220(+)CD19(-) CD43(+)CD24(Lo) bone marrow (BM) Fraction A. Otherwise similar Ly6C(-) cells expressed the natural killer (NK) markers DX5 and NK1.1. pDCs represented a stable, discrete, and long-lived population. Stem cells and early lymphoid progenitors (ELPs), but not prolymphocytes, were effective precursors of pDCs, and their differentiation was blocked by ligation of Notch receptors. Furthermore, pDCs were present in the BM of RAG1(-/-), CD127/IL-7Ra(-/-), and Pax5(-/-) mice. pDCs in RAG1/GFP knock-in mice could be subdivided, and immunoglobulin D(H)-J(H) rearrangements, as well as transcripts for the B-lineage-related genes Pax5, mb1/CD79a, ebf, and Bcl11a, were identified only in the green fluorescent protein-positive (GFP(+)) pDC1 subset. All pDCs expressed terminal deoxynucleotidyl transferase (TdT), the ETS transcription factor Spi-B, the nuclear factor-kappaB transcription factor RelB, toll-like receptor 9 (TLR9), and interferon consensus sequence binding protein (ICSBP)/interferon regulatory factor 8 (IRF-8) transcripts; lacked CD16 and granulocyte colony-stimulating factor receptor (G-CSFR); and were uniformly interleukin-7 receptor alpha (IL-7Ralpha(-)) AA4.1(Lo), CD27(-), Flk-2(Lo), c-Kit(-), DX-5(-), and CD11b(-), while CD4 and CD8alpha were variable. GFP(+) pDC1 subset was less potent than GFP(-) pDC2s in T allostimulation and production of tumor necrosis factor alpha (TNFalpha), interferon alpha (IFNalpha), and interleukin-6 (IL-6), while only pDC2s made IFNgamma and IL-12 p70. Thus, 2 functionally specialized subsets of pDCs arise in bone marrow from progenitors that diverge from B, T, and NK lineages at an early stage.
Figures
Figure 1.
B220+CD19-Ly-6C+CD11cLo cells in bone marrow are functional pDCs. (A, left) Whole bone marrow (wBM) from BALB/c mice was stained for CD45R/B220, Ly-6C, CD19, and CD11c. The B220+CD19- population, gated with an open box, was further resolved and sorted according to CD11c and Ly-6C expression (middle). (Right) Purity of sorted cells. (B) The sorted B220+CD19-Ly-6C+CD11cLo cells were stimulated with CpG-ODNs for 12 hours, and their morphology was assessed by May-Grünwald-Giemsa staining. (Top) Unstimulated cells; (bottom) stimulated cells. (C) Culture supernatants were analyzed for cytokine levels by ELISA after stimulation with CpG-ODNs (▪) or not ( ). These results are representative of those obtained in 4 independent experiments.
Figure 2.
The pDCs in bone marrow are homogeneous with respect to most lympho-hematopoietic–cell antigens and represent a conspicuous subset of Fraction A. (A) Purified B220+CD19-Ly-6C+CD11cLo BM pDCs were labeled with the indicated cell surface markers and analyzed by flow cytometry. Dashed lines indicate isotype controls. (B) BALB/c wBM was stained for CD45R/B220, CD43, and CD19. CD45R/B220+CD43+CD19- cells were gated and sorted as indicated with boxes (i). The recovered cells (middle panel) were then stained with CD24 and resorted as B220+CD43+CD19-CD24-/Lo (Fraction A; ii). Sorted Fraction A cells were then stained and analyzed with respect to CD11c and Ly6C to discriminate B220+CD19-Ly-6C+CD11cLo pDCs among B220+CD43+CD19-CD24-/Lo Fraction A cells. (iii) Total numbers of pDCs (▪) and total Fraction A cells ( ) recovered from 4 harvested bones from 3 strains of mice are shown in the bar graph. Results are presented as the mean ± SD of 5 different experiments.
Figure 3.
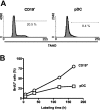
The pDCs in bone marrow are slowly replenished. (A) Purified B220+CD19-CD11cLo pDCs were stained with 7AAD for analysis of DNA content. (B) Mice were injected and then fed BrdU in their drinking water for the indicated intervals when cells were isolated and evaluated by flow cytometry. Enriched B220+CD19-CD11cLo pDCs (□) were compared with B220+CD19+ B-lineage lymphocytes (○).
Figure 4.
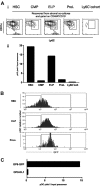
The progenitors of pDCs are within stem cell–containing fraction and early lymphoid progenitors, and are negatively regulated by Notch receptor ligation. (A) Lin-ckitHiSca1+GFP- (stem cell enriched), Lin-ckit+Sca1- GFP-CD34+FcγRLo (myeloid progenitors), Lin-ckitHi Sca-1+GFP+ (early lymphoid progenitors), Lin-ckitLo Sca-1LoGFP+ (prolymphocytes), and B220+CD19- CD11cLoLy6C- (Ly6C- cohort) were isolated from RAG1/GFP knock-in mice. Cells (10 000) of each kind were cultured for 8 days on OP9 stromal cells with Flt3-L. Cells were harvested and stained with CD45R/B220 and CD19. The B220+CD19- population was sorted and restained with CD11c and Ly-6C (i). The yield of CD11cLoLy-6C+ pDCs recovered per input precursor is shown in the bar graph (ii). CMP indicates common myeloid progenitors. (B) GFP expression was analyzed in B220+CD19-CD11cLoLy6C+ pDCs recovered from HSCs, ELPs, and Pro-L cultures. (C) Lin-ckitHi Sca-1+CD27+ ELPs (10 000) from C57BL/6 BM were cultured for 8 days on OP9-GFP or OP9-DL1 stromal cells. The yield of pDCs per input precursor is shown in the bar graph.
Figure 5.
Developmental independence of pDCs on RAG1, RAG2, IL-7Rα, or Pax5. (A) pDC incidence in marrow of RAG1, RAG2, CD127/IL-7Ra, and Pax5 knock-out mice. Results are presented as the mean ± SD of 3 different experiments. (B) pDCs were sorted from BM of 12-day-old _Pax5_-/- and littermate control mice. RT-PCR analysis for expression of the indicated genes was performed with 5-fold serial dilutions of cDNA prepared from these cells. The cDNA input was normalized according to the expression of the control HPRT gene.
Figure 6.
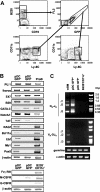
A category of pDCs residing in bone marrow expresses low levels of RAG1, as well as B-lineage–associated genes, and undergoes DH-JH rearrangements. (A) An uncompensated 2-parameter procedure was used to discriminate and sort GFP+ and GFP- subsets of CD45R/B220+CD19--enriched cells from BM of RAG1/GFP knock-in mice. The purified populations were then stained with Ly-6C and CD11c. The boxes in the bottom 2 histograms indicate gates used for an additional sorting of B220+CD19-Ly-6C+CD11cLoGFP+ and B220+CD19-Ly-6C+CD11cLoGFP- pDC subsets. (B) RT-PCR analyses of the indicated genes were performed with cDNA prepared from these 2 sorted subsets and compared with B220+CD19+ CD43+CD24+ pro-B/large pre-B cells or to B220-CD11c+ DCs, while β-actin was used as a loading control. (C) Genomic DNA from these same fractions was evaluated for Ig DHJH and VH-DJH rearrangements and germ-line loci by PCR. Specific products with the expected sizes are labeled with respect to rearrangement to J1, J2, or J3. Alpha actin was used as a control for genome representation.
Figure 7.
RAG1+ pDC1 and RAG1- pDC2 subsets express pDC-related genes but differ with respect to cytokine production and T-cell allostimulation. (A) RT-PCR analyses were performed with cDNA from freshly purified RAG1+ pDC1s, RAG1- pDC2s, B220-CD11c+ DCs, and Lin-ckit+ cells. Primer pairs were used to detect transcripts for ICSBP, TLR9, TLR4, RelB, and SpiB along with β-actin as a control. (B) The 2 categories of pDCs ( , pDC1; ▪, pDC2) were stimulated for 12 hours with CpG-ODNs. Supernatants were analyzed for IFNα, TNFα, IL-6, IL-12p70, and IFNγ levels by ELISA. Results are presented as the mean ± SD of 3 different experiments. (C) Expression of costimulatory molecules was assessed on pDC1s and pDC2s after 18-hour stimulation with CpG-ODNs. Dotted lines indicate unstimulated cells. (D) Preactivated RAG1+ pDC1s (□), RAG1- pDC2s (○), and B220-CD11c+ DCs (▵) were cultured for 6 days with 1 × 10⁵ allogeneic T cells. Proliferation of TCRβ+ cells was measured by BrdU incorporation as described in “Material and methods.” Of 3 experiments, 1 representative is shown. Results are presented as the mean ± SD of 3 different culture wells; one representative experiment of 3 is shown. (E) Intracellular cytokine accumulation was determined in T cells 6 days after priming with preactivated pDC1s or pDC2s, and 5-hour restimulation with PMA and ionomycin.
Similar articles
- Murine plasmacytoid pre-dendritic cells generated from Flt3 ligand-supplemented bone marrow cultures are immature APCs.
Brawand P, Fitzpatrick DR, Greenfield BW, Brasel K, Maliszewski CR, De Smedt T. Brawand P, et al. J Immunol. 2002 Dec 15;169(12):6711-9. doi: 10.4049/jimmunol.169.12.6711. J Immunol. 2002. PMID: 12471102 - A subfraction of B220(+) cells in murine bone marrow and spleen does not belong to the B cell lineage but has dendritic cell characteristics.
Nikolic T, Dingjan GM, Leenen PJ, Hendriks RW. Nikolic T, et al. Eur J Immunol. 2002 Mar;32(3):686-92. doi: 10.1002/1521-4141(200203)32:3<686::AID-IMMU686>3.0.CO;2-I. Eur J Immunol. 2002. PMID: 11857343 - Interferon-producing killer dendritic cells (IKDCs) arise via a unique differentiation pathway from primitive c-kitHiCD62L+ lymphoid progenitors.
Welner RS, Pelayo R, Garrett KP, Chen X, Perry SS, Sun XH, Kee BL, Kincade PW. Welner RS, et al. Blood. 2007 Jun 1;109(11):4825-931. doi: 10.1182/blood-2006-08-043810. Epub 2007 Feb 22. Blood. 2007. PMID: 17317852 Free PMC article. - Fidelity and infidelity in commitment to B-lymphocyte lineage development.
Rolink AG, Schaniel C, Busslinger M, Nutt SL, Melchers F. Rolink AG, et al. Immunol Rev. 2000 Jun;175:104-11. Immunol Rev. 2000. PMID: 10933595 Review. - Induction of osteoclast progenitors in inflammatory conditions: key to bone destruction in arthritis.
Sućur A, Katavić V, Kelava T, Jajić Z, Kovačić N, Grčević D. Sućur A, et al. Int Orthop. 2014 Sep;38(9):1893-903. doi: 10.1007/s00264-014-2386-y. Epub 2014 Jun 10. Int Orthop. 2014. PMID: 24913769 Review.
Cited by
- Lymphoid origin of intrinsically activated plasmacytoid dendritic cells in mice.
Araujo AM, Dekker JD, Garrison K, Su Z, Rhee C, Hu Z, Lee BK, Osorio D, Lee J, Iyer VR, Ehrlich LIR, Georgiou G, Ippolito G, Yi S, Tucker HO. Araujo AM, et al. Elife. 2024 Sep 13;13:RP96394. doi: 10.7554/eLife.96394. Elife. 2024. PMID: 39269281 Free PMC article. - Transcriptional programming mediated by the histone demethylase KDM5C regulates dendritic cell population heterogeneity and function.
Guak H, Weiland M, Ark AV, Zhai L, Lau K, Corrado M, Davidson P, Asiedu E, Mabvakure B, Compton S, DeCamp L, Scullion CA, Jones RG, Nowinski SM, Krawczyk CM. Guak H, et al. Cell Rep. 2024 Aug 27;43(8):114506. doi: 10.1016/j.celrep.2024.114506. Epub 2024 Jul 24. Cell Rep. 2024. PMID: 39052479 Free PMC article. - Plasmacytoid dendritic cells at the forefront of anti-cancer immunity: rewiring strategies for tumor microenvironment remodeling.
Monti M, Ferrari G, Gazzurelli L, Bugatti M, Facchetti F, Vermi W. Monti M, et al. J Exp Clin Cancer Res. 2024 Jul 17;43(1):196. doi: 10.1186/s13046-024-03121-9. J Exp Clin Cancer Res. 2024. PMID: 39020402 Free PMC article. Review. - The Multifaceted Functionality of Plasmacytoid Dendritic Cells in Gastrointestinal Cancers: A Potential Therapeutic Target?
Hansen FJ, David P, Weber GF. Hansen FJ, et al. Cancers (Basel). 2024 Jun 13;16(12):2216. doi: 10.3390/cancers16122216. Cancers (Basel). 2024. PMID: 38927922 Free PMC article. Review. - RAG suppresses group 2 innate lymphoid cells.
Ver Heul AM, Mack M, Zamidar L, Tamari M, Yang TL, Trier AM, Kim DH, Janzen-Meza H, Van Dyken SJ, Hsieh CS, Karo JM, Sun JC, Kim BS. Ver Heul AM, et al. bioRxiv [Preprint]. 2024 Apr 28:2024.04.23.590767. doi: 10.1101/2024.04.23.590767. bioRxiv. 2024. PMID: 38712036 Free PMC article. Preprint.
References
- Asselin-Paturel C, Boonstra A, Dalod M, et al. Mouse type I IFN-producing cells are immature APCs with plasmacytoid morphology. Nat Immunol. 2001;2: 1144-1150. - PubMed
- Blanco P, Palucka AK, Gill M, Pascual V, Banchereau J. Induction of dendritic cell differentiation by IFN-α in systemic lupus erythematosus. Science. 2001;294: 1540-1543. - PubMed
- Jego G, Palucka AK, Blanck JP, et al. Plasmacytoid dendritic cells induce plasma cell differentiation through type I interferon and interleukin 6. Immunity. 2003;19: 225-234. - PubMed
Publication types
MeSH terms
Substances
LinkOut - more resources
Full Text Sources
Other Literature Sources
Medical
Research Materials
Miscellaneous


