Phosphorylation of spinophilin by ERK and cyclin-dependent PK 5 (Cdk5) - PubMed (original) (raw)
Phosphorylation of spinophilin by ERK and cyclin-dependent PK 5 (Cdk5)
Marie Futter et al. Proc Natl Acad Sci U S A. 2005.
Abstract
Spinophilin is a protein that binds to protein phosphatase-1 and actin and modulates excitatory synaptic transmission and dendritic spine morphology. We have identified three sites phosphorylated by ERK2 (Ser-15 and Ser-205) and cyclin-dependent PK 5 (Cdk5) (Ser-17), within the actin-binding domain of spinophilin. Cdk5 and ERK2 both phosphorylated spinophilin in intact cells. However, in vitro, phosphorylation by ERK2, but not by Cdk5, was able to modulate the ability of spinophilin to bind to and bundle actin filaments. In neurons and HEK293 cells expressing GFP-tagged variants of spinophilin, imaging studies demonstrated that introduction of a phospho-site mimic (Ser-15 to glutamate) was associated with increased filopodial density. These results support a role for spinophilin phosphorylation by ERK2 in the regulation of spine morphogenesis.
Figures
Fig. 1.
Spinophilin is phosphorylated in vitro by Cdk5 and ERK2. (A) Time course of phosphorylation of full-length spinophilin by Cdk5 and ERK2. Spinophilin was phosphorylated in the presence of [γ-32P]ATP and the stoichiometry of phosphorylation was assessed after SDS/PAGE and measurement of incorporation of [γ-32P] phosphate into spinophilin. (B) Two-dimensional peptide maps of full-length WT or Ser-17-to-alanine mutant spinophilin (S17A) phosphorylated in vitro by Cdk5. (C) Two-dimensional peptide maps of full-length spinophilin (WT), a Ser-205-to-alanine mutant of the actin-binding domain (residues 1–221) (S205A ABD), or a Ser-15-to-alanine mutant full-length spinophilin (S15A) each phosphorylated in vitro by ERK2. Phosphopeptides are marked numerically.
Fig. 2.
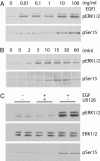
ERK1/2-dependent phosphorylation of spinophilin at _phospho_-Ser-15 in response to EGF stimulation. COS-7 cells were transiently transfected with Flag-tagged spinophilin. Cells were also serum-starved overnight to reduce the basal phosphorylation of spinophilin. (A) Cells were treated with increasing concentrations of EGF for 10 min as indicated. (B) Cells were treated with EGF (100 ng/ml) for increasing time as indicated. (C) Cells were pretreated without (-) or with (+) U0126 (10 μM) for 30 min as indicated and then treated without (-) or with (+) 100 ng/ml EGF for 15 min as indicated. Cell lysates were analyzed by SDS/PAGE and immunoblotting using antibodies to total ERK1/2, _phospho_-ERK1/2 (pERK1/2), and _phospho_-Ser-15 of spinophilin (pSer15). The immunoblots are representative of three experiments. Total levels of ERK1/2 and spinophilin remained the same for all treatments (data not shown).
Fig. 3.
Cdk5 inhibitors reduce phosphorylation of spinophilin at Ser-17 in neurons. (A) Neostriatal slices were treated with the following phosphatase inhibitors: okadaic acid (Oka, 0.2 or 1 μM), calyculin A (Cal, 0.2 μM), or cyclosporin A (Cyc, 10 μM). (B) Slices were treated with the following different Cdk5 inhibitors: roscovitine (Ros, 50 μM), butyrolactone (But, 20 μM), purvanalol (Pur, 50 μM), or allosterpaullone (Als, 50 μM) for 60 min in the presence of okadaic acid (0.2 μM). Cell lysates were analyzed by SDS/PAGE and immunoblotting using antibodies to spinophilin (pSer17 Spino) or DARPP-32 (pThr75 DARPP-32) antibody as indicated. Cumulative data from at least four experiments are shown in the bar graphs (means ± SEM). *, P < 0.01 (one-way ANOVA with post hoc Newman–Keuls multiple-comparison test).
Fig. 4.
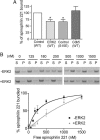
Phosphorylation of spinophilin by ERK2 but not Cdk5 decreases spinophilin binding to and bundling of actin filaments in vitro. (A) WT spinophilin (1–221) was phosphorylated with either Cdk5 or ERK2 and then incubated with F-actin. Spinophilin (1–221) in which Ser-15 was mutated to glutamate also was analyzed. The amount of _phospho_-spinophilin or mutant spinophilin (1–221) bound to actin was calculated as a percentage of _dephospho_-spinophilin (1–221). Data represent means ± SEM for two experiments performed in triplicate. *, P < 0.01 (one-way ANOVA with post hoc Dunnet's multiple-comparison test). (B) Spinophilin (1–221) was incubated without or with ERK2 and incubated with F-actin. The immunoblots and graph demonstrate the effect of ERK2 phosphorylation on actin bundling. Actin bundling was calculated as a fraction of the amount of actin in the pellet compared with total actin input. Data represent means ± SEM for three experiments performed in duplicate or triplicate.
Fig. 5.
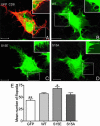
A _phospho_-spinophilin mimic increases filopodial density in HEK293 cells. The images show representative HEK293 cells expressing GFP (green) and CD8 (red) (A), WT GFP-tagged spinophilin (1–221) (WT, green) (B), GFP-spinophilin (1–221) with a Ser-15-to-glutamate mutation (S15E) (C), and GFP-spinophilin (1–221) with a Ser-15-to-alanine mutation (S15A) (D). HEK293 cells were serum-starved overnight to reduce the basal phosphorylation of spinophilin. GFP did not localize to the filopodia (A), and therefore, we used CD8 as a marker to analyze filopodia. (B–D) The GFP signal associated with tagged sphinophilin (1–221) was used to analyze filopodia. Insets show sections of filopodia imaged at higher gain intensity. (Scale bar, 10 μm.) (E) The bar graph shows the mean number of filopodia per cell ± SEM (18 cells were counted for each expressed protein). The mean number of filopodia was 43 ± 13 for GFP, 57 ± 2 for WT spinophilin (1–221), 68 ± 3 for the Ser-15-to-glutamate mutant, and 55 ± 4 for the Ser-15-to-alanine mutant. *, P < 0.05; **, P < 0.01 (one-way ANOVA with post hoc Newman–Keuls multiple-comparison test against WT).
Fig. 6.
A _phospho_-spinophilin mimic increases filopodial density but not filopodial length in hippocampal neurons. (A) Representative segments of dendrites from hippocampal neurons expressing GFP, GFP-tagged WT spinophilin (WT), a Ser-15-to-glutamate mutant (S15E), and a Ser-15-to-alanine mutant (S15A). (Left) GFP fluorescence (green). (Center) CD8 labeling used as a volume marker (red). (Right) Merge of green and red images. (Scale bar, 10 μm.) (B and C) The bar graphs show the mean number of filopodia per neuron ± SEM (B) or mean spine length ± SEM (C). The following numbers of neurons from at least three separate sets of cultures were counted; 7 GFP, 21 WT, 13 Ser-15-to-glutamate, and 9 Ser-15-to-alanine. The mean number of protrusions per 100 μm was 28.0 ± 5.2 for cells expressing GFP, 24.6 ± 1.9 for WT spinophilin, 34.1 ± 2.9 for the Ser-15-to-glutamate mutant, and 28.8 ± 2.6 for the Ser-15-to-alanine mutant. The protrusion length was 2.3 ± 0.1 μm for neurons expressing GFP/CD8, 3.1 ± 0.1 μm for WT spinophilin/CD8, 3.1 ± 0.1 μm for the Ser-15-to-glutamate mutant, and 3.3 ± 0.2 μm for the Ser-15-to-alanine mutant. *, P < 0.05 (one-way ANOVA with post hoc Dunnet's multiple-comparison test against WT).
Similar articles
- Spinophilin is phosphorylated by Ca2+/calmodulin-dependent protein kinase II resulting in regulation of its binding to F-actin.
Grossman SD, Futter M, Snyder GL, Allen PB, Nairn AC, Greengard P, Hsieh-Wilson LC. Grossman SD, et al. J Neurochem. 2004 Jul;90(2):317-24. doi: 10.1111/j.1471-4159.2004.02491.x. J Neurochem. 2004. PMID: 15228588 - Regulation of spinophilin Ser94 phosphorylation in neostriatal neurons involves both DARPP-32-dependent and independent pathways.
Uematsu K, Futter M, Hsieh-Wilson LC, Higashi H, Maeda H, Nairn AC, Greengard P, Nishi A. Uematsu K, et al. J Neurochem. 2005 Dec;95(6):1642-52. doi: 10.1111/j.1471-4159.2005.03491.x. Epub 2005 Nov 21. J Neurochem. 2005. PMID: 16300646 - Phosphorylation of spinophilin modulates its interaction with actin filaments.
Hsieh-Wilson LC, Benfenati F, Snyder GL, Allen PB, Nairn AC, Greengard P. Hsieh-Wilson LC, et al. J Biol Chem. 2003 Jan 10;278(2):1186-94. doi: 10.1074/jbc.M205754200. Epub 2002 Nov 1. J Biol Chem. 2003. PMID: 12417592 - The identification of a second actin-binding region in spinophilin/neurabin II.
Barnes AP, Smith FD 3rd, VanDongen HM, VanDongen AM, Milgram SL. Barnes AP, et al. Brain Res Mol Brain Res. 2004 May 19;124(2):105-13. doi: 10.1016/j.molbrainres.2003.12.020. Brain Res Mol Brain Res. 2004. PMID: 15135218 - The actin-binding domain of spinophilin is necessary and sufficient for targeting to dendritic spines.
Grossman SD, Hsieh-Wilson LC, Allen PB, Nairn AC, Greengard P. Grossman SD, et al. Neuromolecular Med. 2002;2(1):61-9. doi: 10.1385/NMM:2:1:61. Neuromolecular Med. 2002. PMID: 12230305
Cited by
- Modulation of dendritic spines by protein phosphatase-1.
Platholi J, Hemmings HC Jr. Platholi J, et al. Adv Pharmacol. 2021;90:117-144. doi: 10.1016/bs.apha.2020.10.001. Epub 2020 Nov 19. Adv Pharmacol. 2021. PMID: 33706930 Free PMC article. Review. - Role of the Holoenzyme PP1-SPN in the Dephosphorylation of the RB Family of Tumor Suppressors During Cell Cycle.
Verdugo-Sivianes EM, Carnero A. Verdugo-Sivianes EM, et al. Cancers (Basel). 2021 May 6;13(9):2226. doi: 10.3390/cancers13092226. Cancers (Basel). 2021. PMID: 34066428 Free PMC article. Review. - Abeta oligomer-induced aberrations in synapse composition, shape, and density provide a molecular basis for loss of connectivity in Alzheimer's disease.
Lacor PN, Buniel MC, Furlow PW, Clemente AS, Velasco PT, Wood M, Viola KL, Klein WL. Lacor PN, et al. J Neurosci. 2007 Jan 24;27(4):796-807. doi: 10.1523/JNEUROSCI.3501-06.2007. J Neurosci. 2007. PMID: 17251419 Free PMC article. - CDK5 is essential for soluble amyloid β-induced degradation of GKAP and remodeling of the synaptic actin cytoskeleton.
Roselli F, Livrea P, Almeida OF. Roselli F, et al. PLoS One. 2011;6(7):e23097. doi: 10.1371/journal.pone.0023097. Epub 2011 Jul 29. PLoS One. 2011. PMID: 21829588 Free PMC article. - Recruitment of calcium-permeable AMPA receptors during synaptic potentiation is regulated by CaM-kinase I.
Guire ES, Oh MC, Soderling TR, Derkach VA. Guire ES, et al. J Neurosci. 2008 Jun 4;28(23):6000-9. doi: 10.1523/JNEUROSCI.0384-08.2008. J Neurosci. 2008. PMID: 18524905 Free PMC article.
References
- Lendvai, B., Stern, E. A., Chen, B. & Svoboda, K. (2000) Nature 404, 876-881. - PubMed
- Trachtenberg, J. T., Chen, B. E., Knott, G. W., Feng, G., Sanes, J. R., Welker, E. & Svoboda, K. (2002) Nature 420, 788-994. - PubMed
- Fischer, M., Kaech, S., Knutti, D. & Matus, A. (1998) Neuron 20, 847-854. - PubMed
- Fischer, M., Kaech, S., Wagner, U., Brinkhaus, H. & Matus, A. (2000) Nat. Neurosci. 3, 887-894. - PubMed
Publication types
MeSH terms
Substances
LinkOut - more resources
Full Text Sources
Molecular Biology Databases
Miscellaneous


