Intranasal administration of nerve growth factor (NGF) rescues recognition memory deficits in AD11 anti-NGF transgenic mice - PubMed (original) (raw)
Intranasal administration of nerve growth factor (NGF) rescues recognition memory deficits in AD11 anti-NGF transgenic mice
Roberta De Rosa et al. Proc Natl Acad Sci U S A. 2005.
Abstract
Nerve growth factor (NGF) delivery to the brain of patients appears to be an emerging potential therapeutic approach to neurodegenerative disease, such as Alzheimer's disease (AD). The intranasal route of administration could provide an alternative to intracere-broventricular infusion and gene therapy. We previously showed that intranasal administration of NGF determined an amelioration of cholinergic deficit and a decrease in the number of phosphotau-positive neurons and of beta-amyloid accumulation in AD11 mice, which express transgenic antibodies neutralizing NGF action and exhibit a progressive Alzheimer-like neurodegeneration. In this study, we report that the Alzheimer-like neurodegeneration in AD11 mice is linked to progressive behavioral deficits in visual recognition memory and spatial memory starting from 4 months of age. To establish whether intranasal administration of NGF, started after the appearance of the first memory deficits, could revert the cognitive deficits in AD11 mice, we assessed the performance of NGF-treated or control AD11 mice in the object recognition test and in a test of memory for place and context. Deficits exhibited by untreated AD11 mice could be rescued by the intranasal administration of NGF. Thus, this route of administration provides a promising way to deliver NGF to the brain in a therapeutic perspective.
Figures
Fig. 1.
Progression of vORT deficit in AD11 mice. (a) Schematic representation of sample and test conditions in vORT. (b and c) Performance in the vORT tested 1 h(b) and 24 h (c) after the end of the sample phase. The * denotes a significant (P < 0.01) difference between AD11 and WT mice at the given age (t test). The # denotes a significant difference with respect to the performance at 2 months of age for each genotype. Only AD11 mice show a significant decline of performance with age (P = 0.009 for the 1-h interval; P = 0.02 for the 24-h interval).
Fig. 2.
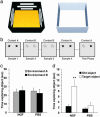
NGF counteracts object-recognition deficits, as shown by the ORT. (a) Example of the objects used for the experiments. (b) Schematic representation of sample and test phase conditions in ORT. (c) Time spent in object exploration during the sample phase. There was no significant difference between the groups of treatment (P = 0.487). (d) Time spent exploring the familiar and the new objects in the test phase. The data show a significant difference within NGF-treated group (P = 0.006), whereas, for the PBS group, a significant difference was not found (P = 0.813). (Error bars represent SEM; **, P < 0.01.)
Fig. 3.
NGF counteracts object-recognition deficits, as shown by the OCT. (a) Three-dimensional representation of conditions A (Left)and B(Right) in OCT. (b) Schematic representation of sample/test conditions in OCT. Condition A is represented by the shaded box, and condition B is shown by the plain box. Objects are represented by the symbols. (c) Object exploration time in the sample phase. There was no difference in both groups (P = 0.600). (d) Mean during exploration for the old object and the target object within each group. A clear difference was evident in the NGF-treated group (P = 0.003). For the PBS group, no significant difference was found (P = 0.397). (Error bars represent SEM; **, P < 0.01.)
Fig. 4.
NGF counteracts object-recognition deficits, as shown by OLT. (a) Representation of sample and test phase conditions in OLT. (b) Mean time spent exploring the objects during the sample phase. There was no significant difference between the groups (P = 0.132). (c) Mean time spent exploring the familiar and the new locations in the test phase. The data show a significant difference in both groups (NGF group, P < 0.001; PBS group, P = 0.032). (Error bars represent SEM; *, P < 0.05; **, P < 0.01.)
Fig. 5.
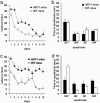
Progression of MWM deficit in AD11 mice. (a) Learning curves for WT and AD11 mice at the age of 7 months. The difference between WT and AD11 mice is significant (genotype, P < 0.001; time, _P_ < 0.001). (_b_) Results of the probe trial at 7 months of age. The platform (located in the NE quadrant during learning) was removed. Both WT and AD11 mice spent significantly more time in the NE quadrant (_P_ < 0.001). (_c_) Learning curves for AD11 and WT mice ages 9–10 months. The difference between WT and AD11 is significant (genotype, _P_ < 0.01; time, _P_ < 0.01). (_d_) Results of the probe trial at 9–10 months of age. The platform (located in the SW quadrant during learning) was removed. WT mice spent significantly more time in the SW quadrant, whereas AD11 mice did not show any significant preference for the SW quadrant (_P_ < 0.001 and _P_ > 0.05, respectively).
Fig. 6.
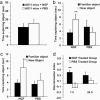
NGF counteracts object recognition deficits, as shown by the vORT. (a) Time engaged in object exploration during the sample phases for vORT. There was not a significant difference between the groups. (Error bars represent SEM.) (b). Time engaged in exploring each object type (new and familiar) during the test phase performed 1 h after the end of the sample phase. (Error bars represent SEM; **, P < 0.01.) (c) Time engaged in exploring each object type (new and familiar) during the test phase performed 24 h after the end of the sample phase. (Error bars represent SEM; **, P < 0.01.) (d) DI in the vORT. Data revealed that in the 1-h delay there was significant difference between the groups (P = 0.007), whereas in the 24-h delay there was not a significant difference (P = 0.300). (Error bars represent SEM; **, P < 0.01.)
Fig. 7.
DI in each experimental condition. The graph shows that the performance of the NGF-treated group was greater than that of the PBS group in the ORT and OCT (P = 0.025 and P = 0.045, respectively). OLT revealed that there was not a significant difference between treated and untreated mice (P = 0.760). (Error bars represent SEM; *, P < 0.05.)
Similar articles
- Intranasal delivery of BDNF rescues memory deficits in AD11 mice and reduces brain microgliosis.
Braschi C, Capsoni S, Narducci R, Poli A, Sansevero G, Brandi R, Maffei L, Cattaneo A, Berardi N. Braschi C, et al. Aging Clin Exp Res. 2021 May;33(5):1223-1238. doi: 10.1007/s40520-020-01646-5. Epub 2020 Jul 16. Aging Clin Exp Res. 2021. PMID: 32676979 Free PMC article. - Environmental enrichment delays the onset of memory deficits and reduces neuropathological hallmarks in a mouse model of Alzheimer-like neurodegeneration.
Berardi N, Braschi C, Capsoni S, Cattaneo A, Maffei L. Berardi N, et al. J Alzheimers Dis. 2007 Jun;11(3):359-70. doi: 10.3233/jad-2007-11312. J Alzheimers Dis. 2007. PMID: 17851186 - A dual mechanism linking NGF/proNGF imbalance and early inflammation to Alzheimer's disease neurodegeneration in the AD11 anti-NGF mouse model.
Capsoni S, Brandi R, Arisi I, D'Onofrio M, Cattaneo A. Capsoni S, et al. CNS Neurol Disord Drug Targets. 2011 Aug;10(5):635-47. doi: 10.2174/187152711796235032. CNS Neurol Disord Drug Targets. 2011. PMID: 21631402 Review. - Delivery of NGF to the brain: intranasal versus ocular administration in anti-NGF transgenic mice.
Capsoni S, Covaceuszach S, Ugolini G, Spirito F, Vignone D, Stefanini B, Amato G, Cattaneo A. Capsoni S, et al. J Alzheimers Dis. 2009;16(2):371-88. doi: 10.3233/JAD-2009-0953. J Alzheimers Dis. 2009. PMID: 19221427 - On the molecular basis linking Nerve Growth Factor (NGF) to Alzheimer's disease.
Capsoni S, Cattaneo A. Capsoni S, et al. Cell Mol Neurobiol. 2006 Jul-Aug;26(4-6):619-33. doi: 10.1007/s10571-006-9112-2. Epub 2006 Aug 31. Cell Mol Neurobiol. 2006. PMID: 16944323 Review.
Cited by
- Regular moderate or intense exercise prevents depression-like behavior without change of hippocampal tryptophan content in chronically tryptophan-deficient and stressed mice.
Lee H, Ohno M, Ohta S, Mikami T. Lee H, et al. PLoS One. 2013 Jul 4;8(7):e66996. doi: 10.1371/journal.pone.0066996. Print 2013. PLoS One. 2013. PMID: 23861751 Free PMC article. - Liposomal Formulations for Nose-to-Brain Delivery: Recent Advances and Future Perspectives.
Hong SS, Oh KT, Choi HG, Lim SJ. Hong SS, et al. Pharmaceutics. 2019 Oct 17;11(10):540. doi: 10.3390/pharmaceutics11100540. Pharmaceutics. 2019. PMID: 31627301 Free PMC article. Review. - Enhanced brain targeting efficiency of intranasally administered plasmid DNA: an alternative route for brain gene therapy.
Han IK, Kim MY, Byun HM, Hwang TS, Kim JM, Hwang KW, Park TG, Jung WW, Chun T, Jeong GJ, Oh YK. Han IK, et al. J Mol Med (Berl). 2007 Jan;85(1):75-83. doi: 10.1007/s00109-006-0114-9. Epub 2006 Nov 7. J Mol Med (Berl). 2007. PMID: 17089096 - Chronic basal forebrain activation improves spatial memory, boosts neurotrophin receptor expression, and lowers BACE1 and Aβ42 levels in the cerebral cortex in mice.
Kumro J, Tripathi A, Lei Y, Sword J, Callahan P, Terry A, Lu XY, Kirov SA, Pillai A, Blake DT. Kumro J, et al. Cereb Cortex. 2023 Jun 8;33(12):7627-7641. doi: 10.1093/cercor/bhad066. Cereb Cortex. 2023. PMID: 36939283 Free PMC article. - Sleeping together using social interactions to understand the role of sleep in plasticity.
Donlea JM, Shaw PJ. Donlea JM, et al. Adv Genet. 2009;68:57-81. doi: 10.1016/S0065-2660(09)68003-2. Epub 2010 Jan 13. Adv Genet. 2009. PMID: 20109659 Free PMC article. Review.
References
- Levi-Montalcini, R. (1952) Ann. N.Y. Acad. Sci. 55, 330-344. - PubMed
- Levi-Montalcini, R. (1987) Science 237, 1154-1162. - PubMed
- Hefti, F., Dravid, A. & Hartikka, J. (1984) Brain Res. 293, 305-311. - PubMed
- Fischer, W., Wictorin, K., Bjorklund, A., Williams, L. R., Varon, S. & Gage, F. H. (1987) Nature 329, 65-68. - PubMed
- Koliatsos, V. E., Price, D. L., Clatterbuck, R. E., Markowska, A. L., Olton, D. S. & Wilcox, B. J. (1993) Ann. NY Acad. Sci. 695, 292-299. - PubMed
Publication types
MeSH terms
Substances
LinkOut - more resources
Full Text Sources
Other Literature Sources
Medical
Molecular Biology Databases


