Re-establishing the regenerative potential of central nervous system axons in postnatal mice - PubMed (original) (raw)
Re-establishing the regenerative potential of central nervous system axons in postnatal mice
Kin-Sang Cho et al. J Cell Sci. 2005.
Abstract
At a certain point in development, axons in the mammalian central nervous system lose their ability to regenerate after injury. Using the optic nerve model, we show that this growth failure coincides with two developmental events: the loss of Bcl-2 expression by neurons and the maturation of astrocytes. Before postnatal day 4, when astrocytes are immature, overexpression of Bcl-2 alone supported robust and rapid optic nerve regeneration over long distances, leading to innervation of brain targets by day 4 in mice. As astrocytes matured after postnatal day 4, axonal regeneration was inhibited in mice overexpressing Bcl-2. Concurrent induction of Bcl-2 and attenuation of reactive gliosis reversed the failure of CNS axonal re-elongation in postnatal mice and led to rapid axonal regeneration over long distances and reinnervation of the brain targets by a majority of severed optic nerve fibers up to 2 weeks of age. These results suggest that an early postnatal downregulation of Bcl-2 and post-traumatic reactive gliosis are two important elements of axon regenerative failure in the CNS.
Figures
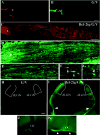
Fig. 1
Robust and rapid optic nerve regeneration in P3 Bcl-2tg mice. Photomicrograph montages of adjacent longitudinal optic nerve sections and confocal epifluorescence photomicrographs show axonal morphology of wt (A,B) and Bcl-2tg (C-G) mice at 24 (A-D) and 48 hours (E-G) after optic nerve crush. The sections revealed CTB-R labeling (A,C) or were stained with antibodies against NF-M (B,D-G). F and G show highermagnification views of axon and growth cone morphologies (100×). Asterisks indicates the crush site; arrowheads indicate growth-cone-like structures. Bar, 100 μm (A-C); 40 μm (D,E); 10 μm (F,G).
Fig. 2
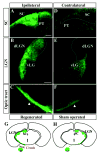
The majority of RGC axons in Bcl-2tg mice regenerate and reach the ipsilateral brain targets within 4 days. (A-F) Epifluorescence photomicrographs of coronal brain sections from a Bcl-2tg mouse on day 4. Note green fluorescence (CTB) in the ipsilateral SC, pretectal nuclei (PT) (A), dorsal (dLGN) and ventral LGN (vLGN) (B), and the optic tract (C). Weak fluorescence is present in the corresponding contralateral targets (D-F_)._ Dotted lines outline the SC and dLGN. Arrows indicate regenerating axons showing positive fluorescence in the optic tract. Bar, 200 μm. (G,H) Schematic drawings of CTB-labeled retinofugal projections in coronal sections of mouse brain. (G) Retinofugal projection formed by regenerating axons in Bcl-2tg mice. (H) Retinofugal projections in normal wt and Bcl-2tg mice. No apparent abnormality of retinal axon projection is noted in uninjured Bcl-2tg mice compared with wt controls.
Fig. 3
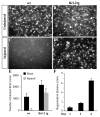
Quantitative assessment of axonal regeneration. (A-D) Photomicrographs of FluoroGold-labeled RGCs in wholemount retinas from injured and uninjured wt and Bcl-2tg mice on day 11 after optic nerve crush. Bar, 50 μm. (E) Number of retrogradely labeled RGCs in the retinal whole-mounts of wt and Bcl-2tg mice that underwent optic nerve crush (injured) or a sham procedure. (F) Distance of axonal regeneration on days 1–4. Values are mean±s.e.m.
Fig. 4
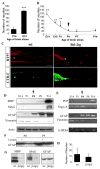
Onset of optic nerve regenerative failure in P5 Bcl-2tg mice coincides with astrocyte maturation. (A,B) Quantification of retinal axon regrowth in retina-midbrain slice co-cultures. Values are mean±s.e.m. (**P<0.01; ***P<0.001). (C) Photomicrograph montages of adjacent longitudinal optic nerve sections at day 4 after optic nerve crush in a P5 wt mouse and a Bcl-2tg mouse. The asterisk indicates the crush site. Bar, 250 μm. (D,E) Western blot analysis (D) and RT-PCR (E) reveal developmental expression patterns of myelin/oligodendrocyte-associated proteins and astrocyte markers in E14-P14 mouse midbrains. (F) Western blot analysis of GFAP expression in P0 and P5 normal (−) and injured (+) midbrain tissues. (G) Western blot analysis confirms the absence of MBP and MAG in the midbrains of jimpy mice. (H) Quantification of retinal axon regrowth into midbrain slices of P14 wt and jimpy mice in retina-midbrain slice co-cultures. Values are mean±s.e.m. (_P=_0.6).
Fig. 5
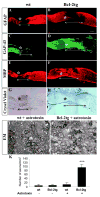
Robust optic nerve regeneration in adult Bcl-2tg mice after treatment with astrotoxin. (A-H) Photomicrograph montages of adjacent longitudinal optic nerve sections on day 8 after optic nerve crush in adult wt and Bcl-2tg mice. The asterisk indicates the crush site. Bar, 250 μm. (I,J) Electron micrographs (EM) of optic nerve sections collected at 0.5 mm posterior to the crush from wt (I) and Bcl-2tg (J) mice treated with astrotoxin. Asterisks indicate crush sites; white lines mark GFAP-negative area. Bar, 1 μm. (K) Quantification of regenerating axons from optic nerve sections. Values are mean±s.e.m. (***P<0.001).
Fig. 6
Robust optic nerve regeneration and target innervation in Bcl-2tgGFAP_−/−_Vim_−/_− mice after P5. (A-D) Photomicrograph montages of adjacent longitudinal optic nerve sections on day 4 after optic nerve crush in P5 GFAP_−/−_Vim_−/_− (G/V) (A,B) and Bcl-2tgGFAP_−/−_Vim_−/_− (Bcl-2tg/G/V) (C,D) mice. The asterisk indicates the crush site. Bar, 100 μm. (E-G) Higher-power views of axon and growth cone morphology (40×) revealed by anti-NF staining. Bars, 40 μm (E); 20 μm (F,G); 5 μm (H-K). Epifluorescence photomicrographs of coronal brain sections from GFAP_−/−_Vim_−/_− (H,J) and Bcl-2tgGFAP_−/−_Vim_−/_− (I,K) mice subjected to optic nerve crush on P14 and examined 4 days later. Note the positive labeling in the ipsilateral optic chiasm (K), dLGN and vLGN, and the optic tract (arrowheads) (I) of Bcl-2tgGFAP_−/−_Vim_−/_− brain sections. Dotted lines outline the dLGN. Bar, 200 μm.
Fig. 7
Target innervation by regenerating axons of Bcl-2tgGFAP_−/−_Vim_−/_− mice after P5. Photomicrographs of whole-mount retinas from Bcl-2tg (A), GFAP_−/−_Vim_−/_− (B), and Bcl-2tgGFAP_−/−_Vim_−/_− (C) mice on day 11 after optic nerve injury, showing FluoroGold-labeled RGCs. Bar, 50 μm. (D) Number of retrogradely labeled RGCs in retinal whole-mounts. Values are mean±s.e.m. (***P<0.001).
Similar articles
- [Optic nerve regeneration in Bcl-2 overexpressing mice].
Yang L, Cho KS. Yang L, et al. Zhonghua Yan Ke Za Zhi. 2005 Sep;41(9):832-6. Zhonghua Yan Ke Za Zhi. 2005. PMID: 16191352 Chinese. - Support of retinal ganglion cell survival and axon regeneration by lithium through a Bcl-2-dependent mechanism.
Huang X, Wu DY, Chen G, Manji H, Chen DF. Huang X, et al. Invest Ophthalmol Vis Sci. 2003 Jan;44(1):347-54. doi: 10.1167/iovs.02-0198. Invest Ophthalmol Vis Sci. 2003. PMID: 12506095 - [Guidance of regenerative axons in optic nerve regeneration in Bcl-2 overexpressing mice].
Yang L, Chen DF. Yang L, et al. Zhonghua Yan Ke Za Zhi. 2006 Feb;42(2):100-3. Zhonghua Yan Ke Za Zhi. 2006. PMID: 16643722 Chinese. - Why do mature CNS neurons of mammals fail to re-establish connections following injury--functions of bcl-2.
Chen DF, Tonegawa S. Chen DF, et al. Cell Death Differ. 1998 Oct;5(10):816-22. doi: 10.1038/sj.cdd.4400431. Cell Death Differ. 1998. PMID: 10203691 Review. - Contact inhibition in the failure of mammalian CNS axonal regeneration.
Johnson AR. Johnson AR. Bioessays. 1993 Dec;15(12):807-13. doi: 10.1002/bies.950151206. Bioessays. 1993. PMID: 8141799 Review.
Cited by
- Augmenting fibronectin levels in injured adult CNS promotes axon regeneration in vivo.
Lukomska A, Rheaume BA, Frost MP, Theune WC, Xing J, Damania A, Trakhtenberg EF. Lukomska A, et al. Exp Neurol. 2024 Sep;379:114877. doi: 10.1016/j.expneurol.2024.114877. Epub 2024 Jun 27. Exp Neurol. 2024. PMID: 38944331 - Suppressing DNMT3a Alleviates the Intrinsic Epigenetic Barrier for Optic Nerve Regeneration and Restores Vision in Adult Mice.
Tai WL, Cho KS, Kriukov E, Ashok A, Wang X, Monavarfeshani A, Yan W, Li Y, Guan T, Sanes JR, Baranov P, Chen DF. Tai WL, et al. bioRxiv [Preprint]. 2023 Nov 23:2023.11.17.567614. doi: 10.1101/2023.11.17.567614. bioRxiv. 2023. PMID: 38014168 Free PMC article. Preprint. - Application of Proteomics Analysis and Animal Models in Optic Nerve Injury Diseases.
Meng Z, You R, Mahmood A, Yan F, Wang Y. Meng Z, et al. Brain Sci. 2023 Feb 26;13(3):404. doi: 10.3390/brainsci13030404. Brain Sci. 2023. PMID: 36979214 Free PMC article. Review. - Astrocyte Responses to Complement Peptide C3a are Highly Context-Dependent.
Pekna M, Siqin S, de Pablo Y, Stokowska A, Torinsson Naluai Å, Pekny M. Pekna M, et al. Neurochem Res. 2023 Apr;48(4):1233-1241. doi: 10.1007/s11064-022-03743-5. Epub 2022 Sep 12. Neurochem Res. 2023. PMID: 36097103 Free PMC article. - Roles of vimentin in health and disease.
Ridge KM, Eriksson JE, Pekny M, Goldman RD. Ridge KM, et al. Genes Dev. 2022 Apr 1;36(7-8):391-407. doi: 10.1101/gad.349358.122. Genes Dev. 2022. PMID: 35487686 Free PMC article. Review.
References
- Bregman BS. Regeneration in the spinal cord. Curr Opin Neurobiol. 1998;8:800–807. - PubMed
- Chen DF, Tonegawa S. Why do mature CNS neurons of mammals fail to re-establish connections following injury-functions of bcl-2. Cell Death Differ. 1998;5:816–822. - PubMed
- Chen DF, Schneider GE, Martinou JC, Tonegawa S. Bcl-2 promotes regeneration of severed axons in mammalian CNS. Nature. 1997;385:434–439. - PubMed
Publication types
MeSH terms
Substances
LinkOut - more resources
Full Text Sources
Other Literature Sources
Molecular Biology Databases
Research Materials

