Dissociation of cohesin from chromosome arms and loss of arm cohesion during early mitosis depends on phosphorylation of SA2 - PubMed (original) (raw)
Dissociation of cohesin from chromosome arms and loss of arm cohesion during early mitosis depends on phosphorylation of SA2
Silke Hauf et al. PLoS Biol. 2005 Mar.
Abstract
Cohesin is a protein complex that is required to hold sister chromatids together. Cleavage of the Scc1 subunit of cohesin by the protease separase releases the complex from chromosomes and thereby enables the separation of sister chromatids in anaphase. In vertebrate cells, the bulk of cohesin dissociates from chromosome arms already during prophase and prometaphase without cleavage of Scc1. Polo-like kinase 1 (Plk1) and Aurora-B are required for this dissociation process, and Plk1 can phosphorylate the cohesin subunits Scc1 and SA2 in vitro, consistent with the possibility that cohesin phosphorylation by Plk1 triggers the dissociation of cohesin from chromosome arms. However, this hypothesis has not been tested yet, and in budding yeast it has been found that phosphorylation of Scc1 by the Polo-like kinase Cdc5 enhances the cleavability of cohesin, but does not lead to separase-independent dissociation of cohesin from chromosomes. To address the functional significance of cohesin phosphorylation in human cells, we have searched for phosphorylation sites on all four subunits of cohesin by mass spectrometry. We have identified numerous mitosis-specific sites on Scc1 and SA2, mutated them, and expressed nonphosphorylatable forms of both proteins stably at physiological levels in human cells. The analysis of these cells lines, in conjunction with biochemical experiments in vitro, indicate that Scc1 phosphorylation is dispensable for cohesin dissociation from chromosomes in early mitosis but enhances the cleavability of Scc1 by separase. In contrast, our data reveal that phosphorylation of SA2 is essential for cohesin dissociation during prophase and prometaphase, but is not required for cohesin cleavage by separase. The similarity of the phenotype obtained after expression of nonphosphorylatable SA2 in human cells to that seen after the depletion of Plk1 suggests that SA2 is the critical target of Plk1 in the cohesin dissociation pathway.
Figures
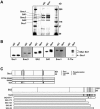
Figure 1. Identification of Mitosis-Specific Phosphorylation Sites on Human Cohesin
(A and B) Cohesin was immunoprecipitated by antibody 447 (which recognizes SA1 and SA2) from extracts prepared from HeLa cells that were either arrested in S-phase by hydroxyurea (HU) or in mitosis by nocodazole (Noc). Cohesin was eluted by buffer of low pH and analyzed by (A) silver staining and (B) immunoblotting with antibodies to cohesin subunits and phosphorylated threonine (P-Thr). (C) Schematic representation of the phosphorylation sites on Scc1 and SA2 that were identified by mass spectrometry, and of the mutant versions of the proteins that have been generated. The star indicates a phosphorylation site that was found in both interphase and mitotic Scc1. All SA2 constructs used for in vitro experiments lack the 69 N-terminal amino acids. SA2-WT-myc and SA2–12xA-myc cell lines contain the entire open reading frame of 1,231 amino acids.
Figure 2. Plk1 Facilitates Cleavage of Human Scc1 by Separase In Vitro
(A) Recombinant, 35S-labeled, wild-type and mutant Scc1 (see Figure 1C) tagged with 9xmyc at the C terminus were incubated with human separase. Recombinant human GST-Plk1 was added to the reaction mixtures where indicated. Samples were withdrawn from the reactions at the indicated time points and analyzed by SDS-PAGE followed by immunoblotting (anti-myc) and Phosphorimager analysis (35S exposure). Arrows indicate full length Scc1-myc (fl), C- and N-terminal fragments resulting from cleavage at Arg172 (Ct #1, Nt #1, respectively), and C- and N-terminal fragments resulting from cleavage at Arg450 (Ct #2, Nt #2, respectively). The lower parts of the membrane or gels were exposed longer than the upper parts. The enhancement of cleavage at Arg172 by Plk1 can be seen particularly well by comparing the intensities of the N-terminal fragments (Nt #1). Note that in the autoradiographs a band can be seen (particularly clearly in the lanes representing the zero time points) that has almost the same electrophoretic mobility as cleavage product Ct #1. This band is distinct from Ct #1 because it migrates a slightly shorter distance and because it is also present in the absence of separase. This band was therefore not included in the quantification in (B). (B) Quantification of the abundance of Scc1-myc and the Scc1-myc cleavage fragments in the assay shown in the left autoradiograph of (A). For the quantification, autoradiographs of identical exposure were used. The sum of the intensities of full-length and all cleavage fragments was set to 100%. Signal intensities for N- and C-terminal fragments resulting from cleavage at the same site were summed. (C) Chromatin fractions were prepared from HeLa cells stably expressing either wild-type Scc1-myc or the mutant Scc1-S454A-myc, and were incubated in either interphase or mitotic Xenopus egg extract. Mitosis-specific cleavage of Scc1 was detected by immunoblotting with myc antibodies.
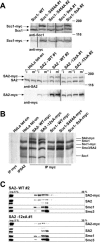
Figure 3. Characterization of HeLa Cell Lines Stably Expressing Wild-Type or Mutant Forms of Human Scc1 and SA2
(A) Wild-type Scc1 or SA2, or the indicated mutant proteins (see Figure 1C), all tagged with 9xmyc at the C terminus, were stably and inducibly expressed in HeLa tet-on cells. After induction by treatment with 2 μg/ml doxycycline for 1–3 d, cell extracts were prepared from either logarithmically proliferating cells (i, interphase) or from cells arrested in mitosis by nocodazole (m, mitosis), then immunoblotted. In the case of Scc1 cell lines (upper blots), only data from interphase extracts are shown. Exogenous protein was detected by immunoblotting with myc antibodies (lower blots). Since the 9xmyc-tag caused a reduced mobility in SDS-PAGE compared to the endogenous protein, Scc1- and SA2-immunoblots (upper blots) revealed the relative amounts of exogenous and endogenous protein in the different cell lines. The position of molecular weight markers is indicated on the right side. (B) Extracts were prepared from the different cell lines as indicated. Immunoprecipitation was performed using myc antibodies, followed by SDS-PAGE and silver staining. As a control, the cohesin complex was immunoprecipitated from untransfected HeLa tet-on cells using antibodies to SA2. (C) Extracts were prepared from SA2-WT-myc or SA2–12xA-myc expressing cells, and fractionated by sucrose density gradient centrifugation (5%–30% sucrose), followed by immunoblotting with antibodies recognizing the proteins indicated on the right (inp. = input/unfractionated sample of the extract).
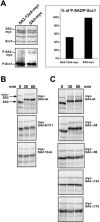
Figure 4. Mutations of the C-Terminal Phosphorylation Sites and C-Terminal Deletions Decrease the Mitotic Phosphorylation of SA2
(A) Cohesin complexes containing wild-type SA2-myc or SA2–12xA-myc were immunopurified by myc antibodies from the respective cell lines. Similar amounts of cohesin were incubated with recombinant GST-Plk1, and the amount of phosphorylation was quantified by 32P incorporation followed by SDS-PAGE, silver staining (top) and Phosphorimager analysis, and quantification using the software program ImageJ. (B and C) In vitro-translated, 35S-labeled SA2 tagged at the N terminus with 9xmyc was incubated in interphase Xenopus egg extracts, which were induced to enter mitosis at time point 0 min by addition of nondegradable cyclin B Δ90 and okadaic acid. Samples were collected at the indicated time points and analyzed by SDS-PAGE followed by Phosphorimager analysis. The autoradiographs in (B) show phosphorylation site mutants and in (C) they show C-terminal deletion mutants (see Figure 1C). The slower-migrating band represents myc-SA2, whereas the faster-migrating band is presumably generated by translation initiation at an internal start codon.
Figure 5. Phosphorylation of SA2 Is Required for Cohesin Dissociation from Chromosome Arms during Prometaphase
(A) Logarithmically proliferating HeLa cells expressing SA2-WT-myc or SA2–12xA-myc were extracted prior to fixation, and stained with myc antibodies. In the upper set of images, kinetochores were labeled with human CREST serum, and DNA was counterstained with DAPI. In the lower set of images, only SA2-myc staining is shown. (B) SA2-myc expression was induced by different amounts of doxycycline (Dox.), and cells were arrested in prometaphase by nocodazole (Noc.) treatment for 3 or 10 h. Cells were spun on glass slides, extracted by detergent, fixed, and processed for immunostaining as in (A). Scale bars 10 μm.
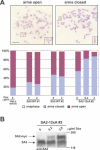
Figure 6. The Presence of SA2–12xA on Chromosome Arms Correlates with Cohesion between Sister Chromatid Arms
(A) Cells were cultured in the absence or presence of different amounts of doxycycline as indicated. After arrest in nocodazole for 3 h, cells were fixed, spread on glass slides, and stained with Giemsa (photomicrographs, above). Single chromosomes (indicated by a box) are shown at higher magnification in the lower right corners. The number of cells with chromosome arms that had opened (arms open) or that were connected (arms closed) was scored as indicated (bar graphs, below). Scale bar 10 μm. (B) Whole-cell extracts were prepared from HeLa cells expressing SA2–12xA-myc after treatment with increasing amounts of doxycycline (0, 0.2, and 2.0 μg/ml). The ratio of exogenous SA2–12xA-myc to endogenous SA2 was visualized by immunoblotting with antibodies to SA2. The position of molecular weight markers is indicated on the right.
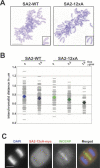
Figure 7. Phosphorylation of SA2 Is Required for Efficient Resolution of Sister Chromatid Arms during Prometaphase and Metaphase
(A) HeLa cells expressing SA2-WT-myc or SA2–12xA-myc were spread on glass slides and chromosomes were stained with Giemsa. Representative cells from SA2 WT-myc or SA2–12xA-myc cell lines after induction with 2 μg/ml doxycycline are shown. Scale bar 10 μm. (B) HeLa cells were induced to express SA2-WT-myc or SA2–12xA-myc by different amounts of doxycycline as indicated, and processed as in (A). More than 50 cells in prometaphase or metaphase were selected randomly from each sample. The distance between sister chromatids was determined for five chromosomes in each cell and averaged. Light gray bars indicate average values that have been measured in one or two cells, and darker gray bars indicate average values that have been measured in three or more cells. Diamonds indicate the average distance for all cells in a given sample. (C) Representative immunofluorescence image of normal anaphase in a cell expressing SA2–12xA-myc. The cell was not extracted prior to fixation, so the soluble pool of SA2–12xA-myc is revealed by myc-staining.
Similar articles
- Regulation of sister chromatid cohesion between chromosome arms.
Giménez-Abián JF, Sumara I, Hirota T, Hauf S, Gerlich D, de la Torre C, Ellenberg J, Peters JM. Giménez-Abián JF, et al. Curr Biol. 2004 Jul 13;14(13):1187-93. doi: 10.1016/j.cub.2004.06.052. Curr Biol. 2004. PMID: 15242616 - The complete removal of cohesin from chromosome arms depends on separase.
Nakajima M, Kumada K, Hatakeyama K, Noda T, Peters JM, Hirota T. Nakajima M, et al. J Cell Sci. 2007 Dec 1;120(Pt 23):4188-96. doi: 10.1242/jcs.011528. Epub 2007 Nov 14. J Cell Sci. 2007. PMID: 18003702 - Shugoshin prevents dissociation of cohesin from centromeres during mitosis in vertebrate cells.
McGuinness BE, Hirota T, Kudo NR, Peters JM, Nasmyth K. McGuinness BE, et al. PLoS Biol. 2005 Mar;3(3):e86. doi: 10.1371/journal.pbio.0030086. Epub 2005 Mar 1. PLoS Biol. 2005. PMID: 15737064 Free PMC article. - Meiotic prophase-like pathway for cleavage-independent removal of cohesin for chromosome morphogenesis.
Challa K, Shinohara M, Shinohara A. Challa K, et al. Curr Genet. 2019 Aug;65(4):817-827. doi: 10.1007/s00294-019-00959-x. Epub 2019 Mar 28. Curr Genet. 2019. PMID: 30923890 Review. - Separase regulation during mitosis.
Uhlmann F. Uhlmann F. Biochem Soc Symp. 2003;(70):243-51. doi: 10.1042/bss0700243. Biochem Soc Symp. 2003. PMID: 14587297 Review.
Cited by
- Structural Insights into Ring Formation of Cohesin and Related Smc Complexes.
Gligoris T, Löwe J. Gligoris T, et al. Trends Cell Biol. 2016 Sep;26(9):680-693. doi: 10.1016/j.tcb.2016.04.002. Epub 2016 Apr 28. Trends Cell Biol. 2016. PMID: 27134029 Free PMC article. Review. - Protein phosphatases and their regulation in the control of mitosis.
Mochida S, Hunt T. Mochida S, et al. EMBO Rep. 2012 Mar;13(3):197-203. doi: 10.1038/embor.2011.263. EMBO Rep. 2012. PMID: 22482124 Free PMC article. Review. - Disengaging the Smc3/kleisin interface releases cohesin from Drosophila chromosomes during interphase and mitosis.
Eichinger CS, Kurze A, Oliveira RA, Nasmyth K. Eichinger CS, et al. EMBO J. 2013 Mar 6;32(5):656-65. doi: 10.1038/emboj.2012.346. Epub 2013 Jan 22. EMBO J. 2013. PMID: 23340528 Free PMC article. - Genetic Interactions Between the Meiosis-Specific Cohesin Components, STAG3, REC8, and RAD21L.
Ward A, Hopkins J, Mckay M, Murray S, Jordan PW. Ward A, et al. G3 (Bethesda). 2016 Jun 1;6(6):1713-24. doi: 10.1534/g3.116.029462. G3 (Bethesda). 2016. PMID: 27172213 Free PMC article. - Polo-like kinase 1 (Plk1): an Unexpected Player in DNA Replication.
Song B, Liu XS, Liu X. Song B, et al. Cell Div. 2012 Feb 6;7:3. doi: 10.1186/1747-1028-7-3. Cell Div. 2012. PMID: 22309699 Free PMC article.
References
- Haering CH, Nasmyth K. Building and breaking bridges between sister chromatids. Bioessays. 2003;25:1178–1191. - PubMed
- Uhlmann F, Lottspeich F, Nasmyth K. Sister-chromatid separation at anaphase onset is promoted by cleavage of the cohesin subunit Scc1. Nature. 1999;400:37–42. - PubMed
- Uhlmann F, Wernic D, Poupart MA, Koonin EV, Nasmyth K. Cleavage of cohesin by the CD clan protease separin triggers anaphase in yeast. Cell. 2000;103:375–386. - PubMed
Publication types
MeSH terms
Substances
LinkOut - more resources
Full Text Sources
Other Literature Sources
Molecular Biology Databases
Miscellaneous
