Quantifying the mechanisms for segmental duplications in mammalian genomes by statistical analysis and modeling - PubMed (original) (raw)
Quantifying the mechanisms for segmental duplications in mammalian genomes by statistical analysis and modeling
Yi Zhou et al. Proc Natl Acad Sci U S A. 2005.
Abstract
A large number of the segmental duplications in mammalian genomes have been cataloged by genome-wide sequence analyses. The molecular mechanisms involved in these duplications mostly remain a matter of speculation. To uncover, test, and further quantify the hypotheses on the mechanisms for the recent duplications in the mammalian genomes, we have performed a series of statistical analyses on the sequences flanking the duplicated segments and proposed a dynamic model for the duplication process. The model, when applied to the human duplication data, indicates that approximately 30% of the recent human segmental duplications were caused by a recombination-like mechanism, among which 12% were mediated by the most recently active repeat, Alu. But a significant proportion of the duplications are caused by some mechanism independent of the repeat distribution. A less sure but similar picture is found in the rodent genomes. A further analysis on the physical features of the flanking sequences suggests that one of the uncharacterized duplication mechanisms shared by the mammalian genomes is surprisingly well correlated with the physical instability in the DNA sequences.
Figures
Fig. 1.
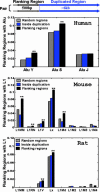
The appearance frequencies of various subfamilies of repeats detected in the duplication flanking regions in the human (hg16 shown here), mouse, and rat genomes. The relationship between the flanking regions and the duplicated regions is shown in a pair of segmental duplications above the top histogram. In this report, the length of the flanking regions is 500 bp, and the duplicated regions are >6 kb. The fractions of the flanking sequences containing different subfamily repeats are compared with the two control sets: sequences randomly selected from the whole genome and sequences randomly selected from inside the duplication regions. The names of the different subfamilies of Alu and L1 are listed on the x axis, roughly ordered according to their ages (from younger to older). Two-sample t tests are used to determine the statistical significance of the repeat overrepresentation in the flanking regions compared with the two controls, respectively. **, The frequency in the flanking regions is significantly higher than that in the controls, with P < 0.05. The statistics are based on the following sample sizes. Human random regions, 20,918; human inside the duplication regions, 13,321; human flanking sequences, 9,788; mouse random regions, 15,824; mouse inside the duplication regions, 6,766; mouse flanking sequences, 3,288; rat random regions, 6,274; rat inside the duplication regions, 3,631; rat flanking sequences, 1,652.
Fig. 2.
A schematic display of our mathematical model formulating the changes in the distribution of flanking region pairs over different states as a Markov process over evolution time. At a particular evolution time, t, the flanking region pairs are distributed over different states (circles), defined by the configuration of the repeats in the flanking region (–/–, +/–, or +/+) and the age group of the duplicated segments (k). During evolution, in each time interval Δ_t_, the flanking region pairs may change their state through many possible transitions (arrows). The change in the distribution of the flanking region pairs in a particular state at time t +Δ_t_ from time t depends on how much has entered into this state from other states and how much has exited out of this state in interval Δ_t_ since time t. The in-flow and out-flow are the sum of the corresponding transition probabilities (1a-7a and 1b-7b), whose details can be found in Table 1. Take _A_2,k (circled red) for example; at evolution time t, the flanking region pairs in state A_2,k can change into other states (blue arrows) in time interval Δ_t. At the same time, the flanking region pairs in other states can change into state _A_2,k (maroon arrows). The difference between _A_2,k(t) and A_2,k(t + Δ_t) can be calculated by taking the difference between the sum of the out-flows (blue arrows) and in-flows (maroon arrows). Given enough evolution time, the process will reach the stationary state, in which the distribution over different states does not change with time any more, because each state has identical in-flow and out-flow. In the _A_2,k example above, the sum of the blue arrows is equal to the sum of the maroon arrows in the stationary state.
Fig. 3.
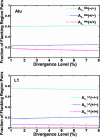
The fitting of the model to the distribution of the Alu and L1 repeats in the duplication flanking regions in the human genome (hg16 shown here). The fractions of flanking region pairs with different repeat distribution patterns are computed in each group of different sequence divergence levels (d). We estimated the parameters and fitted our model to the distribution of Alu and L1 in the flanking region sequence pairs, respectively. The various symbols represent the real data, and the smooth lines are the theoretical trajectories of the model for the optimal choices of the parameters _h_1 and _f_1. The total number of flanking regions pairs is 4,894.
Fig. 4.
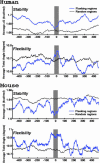
The helix stability and DNA flexibility in the repeatless duplication flanking sequences in the human (hg16 shown here) and mouse genomes. The average helix stability and the average DNA flexibility in the flanking regions around the duplication junction (blue line) and the repeatless random genomic regions (gray line) are estimated by the average Δ_G_ and the average helix twist angle in overlapping 50-bp windows, respectively. The shaded regions indicate the duplication junction where there is a slight decrease in the helix stability and a slight increase in the DNA flexibility. The mapped duplication boundary is at 0 bp, the negative base pair positions are coordinates outside the duplicated region, and the positive base pair positions are coordinates inside the duplicated region.
Similar articles
- Modelling segmental duplications in the human genome.
Abdullaev ET, Umarova IR, Arndt PF. Abdullaev ET, et al. BMC Genomics. 2021 Jul 2;22(1):496. doi: 10.1186/s12864-021-07789-7. BMC Genomics. 2021. PMID: 34215180 Free PMC article. - Association of microsatellite pairs with segmental duplications in insect genomes.
Behura SK, Severson DW. Behura SK, et al. BMC Genomics. 2013 Dec 21;14:907. doi: 10.1186/1471-2164-14-907. BMC Genomics. 2013. PMID: 24359442 Free PMC article. - Segmental duplication density decrease with distance to human-mouse breaks of synteny.
Sainz J, Rovensky P, Gudjonsson SA, Thorleifsson G, Stefansson K, Gulcher JR. Sainz J, et al. Eur J Hum Genet. 2006 Feb;14(2):216-21. doi: 10.1038/sj.ejhg.5201534. Eur J Hum Genet. 2006. PMID: 16306878 - The origins and impact of primate segmental duplications.
Marques-Bonet T, Girirajan S, Eichler EE. Marques-Bonet T, et al. Trends Genet. 2009 Oct;25(10):443-54. doi: 10.1016/j.tig.2009.08.002. Epub 2009 Sep 30. Trends Genet. 2009. PMID: 19796838 Free PMC article. Review. - The evolution of human segmental duplications and the core duplicon hypothesis.
Marques-Bonet T, Eichler EE. Marques-Bonet T, et al. Cold Spring Harb Symp Quant Biol. 2009;74:355-62. doi: 10.1101/sqb.2009.74.011. Epub 2009 Aug 28. Cold Spring Harb Symp Quant Biol. 2009. PMID: 19717539 Free PMC article. Review.
Cited by
- Factors Influencing Gene Family Size Variation Among Related Species in a Plant Family, Solanaceae.
Wang P, Moore BM, Panchy NL, Meng F, Lehti-Shiu MD, Shiu SH. Wang P, et al. Genome Biol Evol. 2018 Oct 1;10(10):2596-2613. doi: 10.1093/gbe/evy193. Genome Biol Evol. 2018. PMID: 30239695 Free PMC article. - The role of retrotransposons in gene family expansions: insights from the mouse Abp gene family.
Janoušek V, Karn RC, Laukaitis CM. Janoušek V, et al. BMC Evol Biol. 2013 May 29;13:107. doi: 10.1186/1471-2148-13-107. BMC Evol Biol. 2013. PMID: 23718880 Free PMC article. - Nearly identical paralogs: implications for maize (Zea mays L.) genome evolution.
Emrich SJ, Li L, Wen TJ, Yandeau-Nelson MD, Fu Y, Guo L, Chou HH, Aluru S, Ashlock DA, Schnable PS. Emrich SJ, et al. Genetics. 2007 Jan;175(1):429-39. doi: 10.1534/genetics.106.064006. Epub 2006 Nov 16. Genetics. 2007. PMID: 17110490 Free PMC article. - Genome-wide mapping and assembly of structural variant breakpoints in the mouse genome.
Quinlan AR, Clark RA, Sokolova S, Leibowitz ML, Zhang Y, Hurles ME, Mell JC, Hall IM. Quinlan AR, et al. Genome Res. 2010 May;20(5):623-35. doi: 10.1101/gr.102970.109. Epub 2010 Mar 22. Genome Res. 2010. PMID: 20308636 Free PMC article. - How homologous recombination generates a mutable genome.
Hurles M. Hurles M. Hum Genomics. 2005 Sep;2(3):179-86. doi: 10.1186/1479-7364-2-3-179. Hum Genomics. 2005. PMID: 16197735 Free PMC article. Review.
References
- Bailey, J. A., Gu, Z., Clark, R. A., Reinert, K., Samonte, R. V., Schwartz, S., Adams, M. D., Myers, E. W., Li, P. W. & Eichler, E. E. (2002) Science 297 1003–1007. - PubMed
Publication types
MeSH terms
LinkOut - more resources
Full Text Sources


