Reversal of the cellular phenotype in the premature aging disease Hutchinson-Gilford progeria syndrome - PubMed (original) (raw)
Reversal of the cellular phenotype in the premature aging disease Hutchinson-Gilford progeria syndrome
Paola Scaffidi et al. Nat Med. 2005 Apr.
Abstract
Hutchinson-Gilford progeria syndrome (HGPS) is a childhood premature aging disease caused by a spontaneous point mutation in lamin A (encoded by LMNA), one of the major architectural elements of the mammalian cell nucleus. The HGPS mutation activates an aberrant cryptic splice site in LMNA pre-mRNA, leading to synthesis of a truncated lamin A protein and concomitant reduction in wild-type lamin A. Fibroblasts from individuals with HGPS have severe morphological abnormalities in nuclear envelope structure. Here we show that the cellular disease phenotype is reversible in cells from individuals with HGPS. Introduction of wild-type lamin A protein does not rescue the cellular disease symptoms. The mutant LMNA mRNA and lamin A protein can be efficiently eliminated by correction of the aberrant splicing event using a modified oligonucleotide targeted to the activated cryptic splice site. Upon splicing correction, HGPS fibroblasts assume normal nuclear morphology, the aberrant nuclear distribution and cellular levels of lamina-associated proteins are rescued, defects in heterochromatin-specific histone modifications are corrected and proper expression of several misregulated genes is reestablished. Our results establish proof of principle for the correction of the premature aging phenotype in individuals with HGPS.
Figures
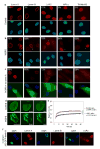
Fig. 1. Wild type GFP-lamin A is insufficient for phenotypic rescue of HGPS cells
(a–c) Immunofluorescence microscopy on primary dermal fibroblasts from a healthy control individual (AG08469; population doublings: 25–30) (a) and a HGPS patient (AG01972; population doublings: 25–30), untreated (b) or transfected with wild type lamin A and GFP as a transfection marker (c). Cells were stained with DAPI (blue) and antibodies (red) against the indicated proteins. Four cells (indicated by arrowheads) with normal staining respectively for lamin B, LAP2, HP1α and Tri-Me-K9 are shown in panel b to directly compare the cellular level of the proteins in unaffected and affected cells. The percentage of cells showing aberrant phenotype is indicated. Scale bar: 10 μm. (d) FRAP analysis of wild type GFP-lamin A in living control and HGPS cells. Nuclei were imaged before and during recovery after the bleach pulse. Scale bar: 5 μm. (e) Kinetics of recovery of the fluorescence signal in the whole bleached area. The statistical significance of the difference between the two recovery curves is indicated. (f) Immunofluorescence microscopy on primary dermal fibroblasts from a healthy control individual (AG08469; population doublings: 25–30) transfected with GFP-Δ50 lamin A. Cells were stained with DAPI (blue) and antibodies (red) against lamin A/C, lamin B, LAP2 proteins. The green fluorescent signal from GFP-Δ50 lamin A is overlaid with the DAPI signal. Scale bar: 10 μm.
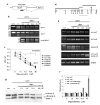
Fig. 2. Correction of aberrant splicing in the endogenous lamin A transcript in HGPS cells
(a) Schematic representation of the region of lamin A pre-mRNA targeted by exo11 antisense oilgonucleotide. The predicted splicing events (dotted line for the normal splicing, dashed line for the aberrant splicing) and the position of exo11 oligonucleotide (black bar) are indicated. (b) RT PCR analysis of control fibroblasts and lymphocytes and HGPS fibroblasts and lymphocytes subjected to 2 sequential electroporations with oligonucleotide or mock treated. (c) Quantitation of exo 11 (black symbols) and scrambled (with symbols) oligonucleotides titration in different cell lines. All values represent averages from 5 independent experiments ±S.D. (d) Schematic representation of the different fragments of lamin A (black bars) and lamin C (gray bar) cDNAs amplified by RT-PCR. (e) RT-PCR analysis and (f) quantification of the indicated fragments after oligonucleotide titration. The intensity of each band was normalized to the intensity of the corresponding β-actin band. (g) Western blot analysis of control cells and HGPS fibroblasts subjected to 3 sequential electroporations with oligonucleotide or mock treated, analyzed 6 days after the first delivery.
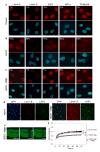
Fig. 3. Phenotypic rescue of HGPS cells by treatment with morpholino oligonucleotide
(a–d) Immunofluorescence microscopy on primary dermal fibroblasts from a healthy control individual (a) and a HGPS patient (AG01972) untreated (b) or treated with oligonucleotide (c). Cells were stained with DAPI (blue) and antibodies (red) against the indicated proteins. The percentage of cells showing aberrant phenotype is indicated. Scale bar: 10 μm. (d) Low magnification images of untreated and treated HGPS cells. Scale bar: 35 μm. (e) FRAP analysis of wt GFP-lamin A in HGPS cells upon splicing correction. A nucleus was imaged before and during recovery after the bleach pulse. Scale bar: 5 μm. (f) Kinetics of recovery of the fluorescence signal in the whole bleached area compared to control and untreated HGPS cells. The statistical significance of the differences between the curves is indicated.
Fig. 4. Restoration of normal gene activity in HGPS cells by treatment with oligonucleotide
(a) RNAse protection assay on control cells (CRL-1474) and HGPS cells (AG11498) subjected to 3 electroporations with oligonucleotide or mock treated. A longer exposure of the gel is shown for CCL8, MMP3, HAS III and MMP14 due to the low expression level of those genes compared to STAT3, TIMP3, L32 and GAPDH. (b) Quantitation of gene expression levels. Values represent fold differences of the indicated mRNAs levels between untreated and treated HGPS cells and control cells. Values are averages from at least 3 independent experiments ±S.D.
Comment in
- The curious case of the ageing cells.
Gruenbaum Y. Gruenbaum Y. Nat Rev Mol Cell Biol. 2009 Apr;10(4):242. doi: 10.1038/nrm2666. Nat Rev Mol Cell Biol. 2009. PMID: 19309769 No abstract available.
Similar articles
- Incomplete processing of mutant lamin A in Hutchinson-Gilford progeria leads to nuclear abnormalities, which are reversed by farnesyltransferase inhibition.
Glynn MW, Glover TW. Glynn MW, et al. Hum Mol Genet. 2005 Oct 15;14(20):2959-69. doi: 10.1093/hmg/ddi326. Epub 2005 Aug 26. Hum Mol Genet. 2005. PMID: 16126733 - Dermal fibroblasts in Hutchinson-Gilford progeria syndrome with the lamin A G608G mutation have dysmorphic nuclei and are hypersensitive to heat stress.
Paradisi M, McClintock D, Boguslavsky RL, Pedicelli C, Worman HJ, Djabali K. Paradisi M, et al. BMC Cell Biol. 2005 Jun 27;6:27. doi: 10.1186/1471-2121-6-27. BMC Cell Biol. 2005. PMID: 15982412 Free PMC article. - Epigenetic involvement in Hutchinson-Gilford progeria syndrome: a mini-review.
Arancio W, Pizzolanti G, Genovese SI, Pitrone M, Giordano C. Arancio W, et al. Gerontology. 2014;60(3):197-203. doi: 10.1159/000357206. Epub 2014 Feb 28. Gerontology. 2014. PMID: 24603298 Review. - Hutchinson-Gilford progeria syndrome through the lens of transcription.
Prokocimer M, Barkan R, Gruenbaum Y. Prokocimer M, et al. Aging Cell. 2013 Aug;12(4):533-43. doi: 10.1111/acel.12070. Epub 2013 Apr 19. Aging Cell. 2013. PMID: 23496208 Review.
Cited by
- Nuclear envelope budding inhibition slows down progerin-induced aging process.
Wang X, Ma L, Lu D, Zhao G, Ren H, Lin Q, Jia M, Huang F, Wang S, Xu Z, Yang Z, Chu Y, Xu Z, Li W, Yu L, Jiang Q, Zhang C. Wang X, et al. Proc Natl Acad Sci U S A. 2024 Oct 8;121(41):e2321378121. doi: 10.1073/pnas.2321378121. Epub 2024 Oct 1. Proc Natl Acad Sci U S A. 2024. PMID: 39352925 - Protein isoform-centric therapeutics: expanding targets and increasing specificity.
Kjer-Hansen P, Phan TG, Weatheritt RJ. Kjer-Hansen P, et al. Nat Rev Drug Discov. 2024 Oct;23(10):759-779. doi: 10.1038/s41573-024-01025-z. Epub 2024 Sep 4. Nat Rev Drug Discov. 2024. PMID: 39232238 Review. - Navigating Lipodystrophy: Insights from Laminopathies and Beyond.
Krüger P, Hartinger R, Djabali K. Krüger P, et al. Int J Mol Sci. 2024 Jul 23;25(15):8020. doi: 10.3390/ijms25158020. Int J Mol Sci. 2024. PMID: 39125589 Free PMC article. Review. - Emerging Roles of Vitamin B12 in Aging and Inflammation.
Simonenko SY, Bogdanova DA, Kuldyushev NA. Simonenko SY, et al. Int J Mol Sci. 2024 May 6;25(9):5044. doi: 10.3390/ijms25095044. Int J Mol Sci. 2024. PMID: 38732262 Free PMC article. Review. - Differential Expression of LMNA/C and Insulin Receptor Transcript Variants in Peripheral Blood Mononuclear Cells of Leukemia Patients.
Alshaalan KS, Albawardi TK, Zhra M, Bin Sulaiman N, Jnied OY, Saleem RA, Aljada A. Alshaalan KS, et al. J Clin Med. 2024 Apr 27;13(9):2568. doi: 10.3390/jcm13092568. J Clin Med. 2024. PMID: 38731097 Free PMC article.
References
- DeBusk FL. The Hutchinson-Gilford progeria syndrome. Report of 4 cases and review of the literature. J Pediatr. 1972;80:697–724. - PubMed
- Uitto J. Searching for clues to premature aging. . Trends Endocrinol Metab. 2002;13:140–141. - PubMed
- De Sandre-Giovannoli A, et al. Lamin A truncation in Hutchinson-Gilford progeria. Science. 2003;300:2055. - PubMed
MeSH terms
Substances
LinkOut - more resources
Full Text Sources
Other Literature Sources
Research Materials
Miscellaneous


