Identification of developmentally specific enhancers for Tsix in the regulation of X chromosome inactivation - PubMed (original) (raw)
Identification of developmentally specific enhancers for Tsix in the regulation of X chromosome inactivation
Nicholas Stavropoulos et al. Mol Cell Biol. 2005 Apr.
Abstract
X chromosome inactivation silences one of two X chromosomes in the mammalian female cell and is controlled by a binary switch that involves interactions between Xist and Tsix, a sense-antisense pair of noncoding genes. On the future active X chromosome, Tsix expression suppresses Xist upregulation, while on the future inactive X chromosome, Tsix repression is required for Xist-mediated chromosome silencing. Thus, understanding the binary switch mechanism depends on ascertaining how Tsix expression is regulated. Here we have taken an unbiased approach toward identifying Tsix regulatory elements within the X chromosome inactivation center. First, we defined the major Tsix promoter and found that it cannot fully recapitulate the developmental dynamics of Tsix expression, indicating a requirement for additional regulatory elements. We then delineated two enhancers, one classical enhancer mapping upstream of Tsix and a bipartite enhancer that flanks the major Tsix promoter. These experiments revealed the intergenic transcription element Xite as an enhancer of Tsix and the repeat element DXPas34 as a component of the bipartite enhancer. Each enhancer contains DNase I-hypersensitive sites and appears to confer developmental specificity to Tsix expression. Characterization of these enhancers will facilitate the identification of trans-acting regulatory factors for X chromosome counting and choice.
Figures
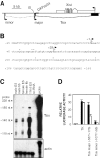
FIG. 1.
Functional delineation of the major Tsix promoter. (A) Map of the Xist/Tsix locus. White boxes, Xist exons; black boxes, Tsix exons; broken line, less abundant Tsix transcripts; grey rectangle, DXPas34 repeat array; B, BamHI. (B) Sequence proximal to the major initiation site. The 5′ terminus is the BamHI site in panel A. Previously described 5′ RACE termini are indicated by plus signs (, , ; D. Warshawsky, unpublished data). Arrows denote start sites defined by RNase protection analysis (see panel C). (C) RNase protection analysis at the major Tsix initiation site. Results obtained with Tsix (top panel) and actin (bottom panel) probes are shown. The Tsix riboprobe contains a 31-nt 5′ leader sequence fused to a 189-nt Tsix sequence antisense to that shown in panel B. 116.6 ES cells bear ∼25 copies of the Xic (23). (D) Activities of the major and minor Tsix promoters. Mean luciferase activities are shown for transiently transfected male ES cells (black bars) and female ES cells (white bars). Error bars denote one standard error. The activity of the backbone vector was set to 1. The major promoter is numbered as in panel B; the minor promoter is numbered with respect to the minor start site (35).
FIG. 2.
The major Tsix promoter is constitutively active and is contained within a 276-bp region. (A to C) Activities of Tsix promoter deletion derivatives. Mean luciferase activities are shown for transiently transfected male ES cells (black bars) and female ES cells (white bars). Error bars denote one standard error. The activity of the +557/+176 fragment was set to 1. (D) The major Tsix promoter is constitutively active. Mean luciferase activities are shown for transiently transfected immortalized female mouse fibroblasts (dark grey bars), male NIH 3T3 fibroblasts (light grey bars), and differentiated female ES cells (days 11 to 17) (white bars). Error bars denote one standard error. The activity of the backbone vector was set to 1. (E) Anatomy of the major Tsix promoter. Inferred locations of positive elements are indicated by ovals within denoted sequence intervals.
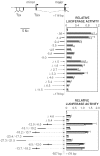
FIG. 3.
Identification of enhancing activities in the Xite region. Mean luciferase activities are shown for transiently transfected male ES cells (black bars) and female ES cells (white bars). Error bars denote one standard error. The activity of the Tsix promoter (−557/+176; not shown) was set to 1. A map of the Tsix upstream region is shown at the top, with terminal Tsx exons at the left. (Upper panel) Assay of contiguous Tsix sequences extending from bp +116 to kb −9; λ sequences are coupled to the Tsix promoter (−557/+176). (Lower panel) Assay of distal sequences extending from kb −6.5 to −27.3. The orientations of selected fragments are indicated.
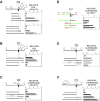
FIG. 4.
Xite contains a 1.2-kb enhancer that is developmentally specific. (A) Deletion analysis of the upstream enhancer. Sc, ScaI; X, XhoI; S, StuI; A, AvrII. The orientations of selected fragments are indicated. Mean luciferase activities are shown for transiently transfected male ES cells (black bars) and female ES cells (white bars). Error bars denote one standard error. The activity of the Tsix promoter (−557/+176) was set to 1. (B) The 1.2-kb enhancer stimulates the Tsix promoter from its natural context. The activity of the Tsix promoter (−557/+116; not shown) was set to 1. (C) Bidirectional promoter activities of the 1.2-kb element. In this and subsequent panels, the forward (F) orientation of the 1.2-kb element is that in which the downstream (kb −9) terminus abuts the luciferase reporter; in the reverse (R) orientation, the upstream (kb −10.2) terminus abuts the reporter. The activity of the backbone vector was set to 1. (D) The 1.2-kb enhancer is unable to stimulate the Tsix promoter (−557/+176) in differentiated cell types. Mean luciferase activities are shown for immortalized female fibroblasts (grey bars) and differentiated female ES cells (days 11 to 17) (white bars). The activity of the Tsix promoter (−557/+176) was set to 1. (E) Bidirectional promoter activities are reduced in differentiated cell types. Mean luciferase activities are shown for transiently transfected NIH 3T3 fibroblasts (grey bars) and differentiated female ES cells (days 11 to 17) (white bars). The activity of the backbone vector was set to 1. (F) The enhancer is unable to stimulate the Xist promoter in undifferentiated ES cells. The 1.2-kb enhancer was assayed in the indicated orientation upstream of the Xist P1 promoter (−540/+9) or the Xist P2 promoter (−601/+21). Mean luciferase activities are shown for transiently transfected male ES cells (black bars) and female ES cells (white bars). The activity of the Tsix promoter (−557/+176) was set to 1.
FIG. 5.
A bipartite enhancer flanks the Tsix promoter and is developmentally specific. In sequence schematics, alternatively spliced exons 2′ and 3 are omitted for clarity; L, luciferase cassette. DXPas34 is shown as a rectangle between kb +0.7 and +1.9. For all panels except E, mean luciferase activities are shown for transiently transfected male ES cells (black bars) and female ES cells (white bars). For all panels except D, the activity of upstream sequences in isolation was set to 1. Error bars denote one standard error. (A) Synergistic stimulation of the Tsix promoter by combinations of upstream and downstream sequences. (B) DXPas34 is required for stimulation. (C) Stimulation depends specifically on Tsix sequences. Bacteriophage λ sequences are labeled. (D) Swap of upstream and downstream sequences preserves stimulation. Orientations of upstream (green) and downstream (red) sequences are indicated. The activity of the native configuration was set to 1. The backbone was pNS185. (E) Combinatorial stimulation is absent in differentiated cells. Mean luciferase activities are shown for transiently transfected differentiated female ES cells (days 11 to 17) (lower bar in each set) and male NIH 3T3 fibroblasts (upper bar in each set). (F) Stimulation of the promoter by the 1.2-kb enhancer and more proximal upstream and downstream regions.
FIG. 6.
DHS mapping in the bipartite enhancer. Sequence schematics of analyzed regions are shown at the left. The positions of DXPas34 (white rectangle), the major Tsix promoter, and hybridization probes (black rectangles) are indicated. Mobilities of control DNA fragments terminating at the indicated restriction sites are shown to the left of each panel by horizontal tick marks. Positions of hypersensitive sites are shown to the right of each panel by arrowheads. From left to right, the DNase concentrations used for ES cells were 0, 0.5, 1, 2.5, 5, and 10 μg/ml and those used for fibroblasts were 0, 5, 10, 20, 40, and 80 μg/ml. (A) DHS mapping from −5.9 to −0.04 kb. (B) DHS mapping from −0.7 to +4.0 kb.
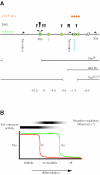
FIG. 7.
Tsix control elements and Tsix binary switch model. (A) Summary of Tsix transcriptional regulatory sequences known to date. Embryonic specific stimulatory elements are shown in the context of genes, functional elements, and selected deletions in Xic. The novel enhancers are shown in green: dark green, 1.2-kb enhancer; light green, bipartite enhancer with multiple elements therein. The exact position of the light green element marked by a question mark is not known. Circles, CTCF elements; closed arrowheads, ES-specific hypersensitive sites; open arrowheads, constitutive DHS; largest arrowhead, strongest DHS. (B) Model for the binary switch through positive and negative control of Tsix expression. In this model, the Xite enhancer promotes the persistence of Tsix expression in cis but does not exert a major influence on the quantitative level of Tsix expression. The activity of the Xite enhancer is lost gradually as differentiation proceeds and, in conjunction with the induction of unidentified negative regulatory influences, yields the asynchronous silencing of Tsix expression (21).
Similar articles
- Tsix, a gene antisense to Xist at the X-inactivation centre.
Lee JT, Davidow LS, Warshawsky D. Lee JT, et al. Nat Genet. 1999 Apr;21(4):400-4. doi: 10.1038/7734. Nat Genet. 1999. PMID: 10192391 - A functional role for Tsix transcription in blocking Xist RNA accumulation but not in X-chromosome choice.
Stavropoulos N, Lu N, Lee JT. Stavropoulos N, et al. Proc Natl Acad Sci U S A. 2001 Aug 28;98(18):10232-7. doi: 10.1073/pnas.171243598. Epub 2001 Jul 31. Proc Natl Acad Sci U S A. 2001. PMID: 11481444 Free PMC article. - CTCF, a candidate trans-acting factor for X-inactivation choice.
Chao W, Huynh KD, Spencer RJ, Davidow LS, Lee JT. Chao W, et al. Science. 2002 Jan 11;295(5553):345-7. doi: 10.1126/science.1065982. Epub 2001 Dec 6. Science. 2002. PMID: 11743158 - X-tra! X-tra! News from the mouse X chromosome.
Thorvaldsen JL, Verona RI, Bartolomei MS. Thorvaldsen JL, et al. Dev Biol. 2006 Oct 15;298(2):344-53. doi: 10.1016/j.ydbio.2006.07.011. Epub 2006 Jul 15. Dev Biol. 2006. PMID: 16916508 Review. - An embryonic story: analysis of the gene regulative network controlling Xist expression in mouse embryonic stem cells.
Navarro P, Avner P. Navarro P, et al. Bioessays. 2010 Jul;32(7):581-8. doi: 10.1002/bies.201000019. Bioessays. 2010. PMID: 20544740 Review.
Cited by
- The X as model for RNA's niche in epigenomic regulation.
Lee JT. Lee JT. Cold Spring Harb Perspect Biol. 2010 Sep;2(9):a003749. doi: 10.1101/cshperspect.a003749. Epub 2010 Mar 31. Cold Spring Harb Perspect Biol. 2010. PMID: 20739414 Free PMC article. Review. - Differentiation-dependent requirement of Tsix long non-coding RNA in imprinted X-chromosome inactivation.
Maclary E, Buttigieg E, Hinten M, Gayen S, Harris C, Sarkar MK, Purushothaman S, Kalantry S. Maclary E, et al. Nat Commun. 2014 Jun 30;5:4209. doi: 10.1038/ncomms5209. Nat Commun. 2014. PMID: 24979243 Free PMC article. - Sex-specific silencing of X-linked genes by Xist RNA.
Gayen S, Maclary E, Hinten M, Kalantry S. Gayen S, et al. Proc Natl Acad Sci U S A. 2016 Jan 19;113(3):E309-18. doi: 10.1073/pnas.1515971113. Epub 2016 Jan 6. Proc Natl Acad Sci U S A. 2016. PMID: 26739568 Free PMC article. - Dynamic interplay and function of multiple noncoding genes governing X chromosome inactivation.
Yue M, Charles Richard JL, Ogawa Y. Yue M, et al. Biochim Biophys Acta. 2016 Jan;1859(1):112-20. doi: 10.1016/j.bbagrm.2015.07.015. Epub 2015 Aug 7. Biochim Biophys Acta. 2016. PMID: 26260844 Free PMC article. Review. - Gene regulation in time and space during X-chromosome inactivation.
Loda A, Collombet S, Heard E. Loda A, et al. Nat Rev Mol Cell Biol. 2022 Apr;23(4):231-249. doi: 10.1038/s41580-021-00438-7. Epub 2022 Jan 10. Nat Rev Mol Cell Biol. 2022. PMID: 35013589 Review.
References
- Ausubel, F. M., et al. (ed.). 1995. Current protocols in molecular biology. John Wiley & Sons, Inc., New York, N.Y.
- Avner, P., and E. Heard. 2001. X-chromosome inactivation: counting, choice and initiation. Nat. Rev. Genet. 2:59-67. - PubMed
- Avner, P., M. Prissette, D. Arnaud, B. Courtier, C. Cecchi, and E. Heard. 1998. Molecular correlates of the murine Xce locus. Genet. Res. 72:217-224. - PubMed
- Bell, A. C., and G. Felsenfeld. 2000. Methylation of a CTCF-dependent boundary controls imprinted expression of the Igf2 gene. Nature 405:482-485. - PubMed
- Bell, A. C., A. G. West, and G. Felsenfeld. 1999. The protein CTCF is required for the enhancer blocking activity of vertebrate insulators. Cell 98:387-396. - PubMed
Publication types
MeSH terms
Substances
LinkOut - more resources
Full Text Sources
Other Literature Sources


