Binding specificity and mRNA targets of a C. elegans PUF protein, FBF-1 - PubMed (original) (raw)
Binding specificity and mRNA targets of a C. elegans PUF protein, FBF-1
David Bernstein et al. RNA. 2005 Apr.
Abstract
Sequence-specific RNA-protein interactions underlie regulation of many mRNAs. Here we analyze the RNA sequence specificity of Caenorhabditis elegans FBF-1, a founding member of the PUF protein family. Like other PUF proteins, FBF-1 binds to the 3' UTR of target mRNAs and decreases expression of those target genes. Here, we show that FBF-1 and its close relative, FBF-2, bind with similar affinity to multiple RNA sites. We use mutagenesis and in vivo selection experiments to identify nucleotides that are essential for FBF-1 binding. The binding elements comprise a "core" central region and flanking sequences. The core region is similar but distinct from the binding sites of other PUF proteins. We combine the identification of binding elements with informatics to predict new FBF-1 binding sites in a C. elegans 3' UTR database. These data identify a set of new candidate mRNA targets of FBF-1 and FBF-2.
Figures
FIGURE 1.
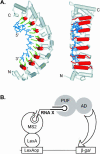
PUF/RNA interactions are specific. (A) A PUF protein binding RNA. A depiction of the interaction between human Pumilio1 and the NRE (crystal coordinates from Wang et al. 2002). RNA binding helices are red cylinders, RNA binding amino acid side chains are green, and the RNA is blue. (Left) A side view of the RNA binding face. (Right) The same image rotated 90° to present a straight-on view of the RNA binding face. Amino (N) and carboxy (C) termini of the protein are indicated, along with the 5′ and 3′ ends of the RNA. The region corresponding to what we define as the core binding element is that depicted in blue. RNA binding amino acid side chains are not depicted. (B) The yeast three-hybrid assay. A fusion protein consisting of the LexA DNA binding protein linked to MS2 coat protein tethers a hybrid RNA to the promoter region upstream of a reporter gene (e.g., LacZ). Interaction between a segment of the hybrid RNA (“RNA X”) and the PUF protein activates transcription of the reporter via a transcription activation domain (AD). (C) β-Galactosidase expression in yeast expressing combinations of PUF proteins and RNA binding sites. PUF proteins were tested in combination with their own RNA targets and those of other PUF proteins. Shown are the results of a single set of LacZ assays using colonies grown on a plate and transferred to a filter. Citations to each PUF–RNA combination are as follows: C. elegans FBF/gld-1 RNA (Crittenden et al. 2002); C. elegans FBF/fem-3 RNA (Zhang et al. 1997); Drosophila Pumilio/hunchback (hb) NRE (Zamore et al. 1997; Sonoda and Wharton 1999); Xenopus Pumilio/hb RNA (Nakahata et al. 2003); S. cerevisiae Puf5p/HO RNA (Tadauchi et al. 2001); S. cerevisiae Puf3p/COX17 RNA (Olivas and Parker 2000; Jackson et al. 2004).
FIGURE 2.
FBF-1 binding to the gld-1 FBEa and the fem-3 PME. (A) Binding sites. The sequence of two FBF binding sites are shown. The predicted core binding elements (see text) are highlighted in black. Numbering begins with +1 at the first uridine of the conserved UGU trinucleotide. (B) Affinities. Various concentrations of purified, recombinant FBF-1 were incubated with labeled FBEa and PME RNAs in vitro and analyzed by electrophoretic mobility shift assays. Protein concentrations are indicated above the gel; for ease of comparison, arrowheads indicate 20 nM FBF-1. Concentrations were 0.01, 0.05, 0.1, 0.5, and 1, then doubled beginning at 5 nM; the 0.01, 0.05, and 0.1 points were omitted for the PME. The leftmost lane lacks protein. Apparent K d was estimated by fitting a curve to the percentages of total shifted material. Also presented are phenotypes observed in the yeast three-hybrid assay. LacZ activity was monitored in a luminometer using a linked assay (Hook et al. 2005); error terms represent the standard deviation of six repetitions. HIS3 activity was monitored by growth on increasing concentrations of 3-aminotriazole, a competitive inhibitor of His3p (Bernstein et al. 2002).
FIGURE 3.
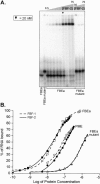
FBF-1 and FBF-2 exhibit similar binding characteristics. (A) FBF-2 binding the FBEa. Various concentrations of purified, recombinant FBF-2 were incubated with labeled FBEa and FBEa mutant RNAs in vitro and analyzed by electrophoretic mobility shift assays. FBF-2 concentrations tested with the FBEa were 0.5, 0.75, 1, 5, 10, 25, 35, 50, and 75 nM; the FBEa mutant was combined with 35, 50, and 75 nM protein. Arrowhead indicates 25 nM FBF-2. The two leftmost lanes lack protein. (B) FBF-1 versus FBF-2. Binding curves comparing the affinity of FBF-1 (dashed line) and FBF-2 (solid line) for three RNAs. Bound fraction of the RNA was calculated from densitometry readings of the shifted and unshifted RNA in each lane.
FIGURE 4.
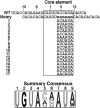
A randomization-selection screen to identify optimal core binding sites. (Top) Sequence of the wild-type FBEa (“WT”) and the randomized library (“n” indicates all four bases were present equally). The sequences of 17 recovered RNAs that bind FBF-1 are indicated. (Bottom) A summary sequence derived from the selection experiments.
FIGURE 5.
Mutational analysis of the core binding element. (A) Double nucleotide substitutions in the FBEa. Substitutions are indicated in lowercase; core element is boxed. β-Galactosidase values are relative to the wild-type FBEa; error bars represent the standard deviation of six repetitions. (B) Single nucleotide substitutions in the FBEa. “x” indicates position of the substitutions; every nucleotide identity was assayed at each position. (Box) The core element. β-Galactosidase values are relative to the wild-type FBEa; error bars represent the standard deviation of six repetitions. The wild-type identity is labeled at each position. (C) Summary. A summary sequence of the FBF-1 core binding element based on the experiments in A and B.
FIGURE 6.
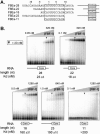
The core binding element is insufficient for high-affinity binding. (A) Constructs. Sequences and schematic diagrams of oligoribonucleotides used. (Box) The core element. (B) Electrophoretic mobility shift assays using purified, recombinant FBF-1. Arrowheads indicate 20 nM FBF-1. Nucleotide length corresponds to oligoribonucleotides in A. Protein concentrations were 0.05, 0.1, 0.5, and 1, then doubled beginning at 5 nM; concentration ranges are indicated. The leftmost lane lacks protein. Apparent K d was estimated by fitting a curve to the percentages of total shifted RNA, calculated from densitometry readings.
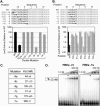
FIGURE 7.
FBF-1 is sensitive to mutation upstream of the core binding element. (A) Double nucleotide substitutions upstream of the core binding element. Substitutions are indicated in lowercase; core element is boxed. β-Galactosidase values are relative to the wild-type FBEa; error bars represent the standard deviation of six repetitions. (B) Single nucleotide substitutions upstream of the core binding element. “x” indicates the position of the substitutions; every nucleotide identity was assayed at each position. (Box) The core element. β-Galactosidase values are relative to the wild-type FBEa; error bars represent the standard deviation of six repetitions. The wild-type identity is labeled at each position. (C) Affinities. A table of apparent binding constants of FBEa RNA oligonucleotides carrying substitutions at either position -8 or -7; the lowercase letter indicates the substitution. Apparent K d was estimated by fitting a curve to the percentages of total shifted RNA, calculated from densitometry readings. (D) Example gel mobility shift assays. Two mutant FBEa oligoribonucleotides carrying substitutions at position -7, shifted with purified recombinant FBF-1. Arrowheads indicate 20 nM FBF-1. Protein concentrations were doubled beginning at 5 nM in lane 3 of each gel; the leftmost lane lacks protein and the adjacent lane contains 1 nM FBF-1.
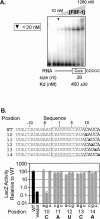
FIGURE 8.
Nucleotides downstream of the core binding element are critical for interaction with FBF-1. (A) A 3′ requirement. An electrophoretic mobility shift assay in which the 3′ region of the FBEa has been substituted with a poly(C) track. Arrowhead indicates 20 nM FBF-1. Concentrations were doubled beginning at 10 nM; the leftmost lane lacks protein. Apparent K d was estimated by fitting a curve to the percentages of total shifted material, calculated from densitometry readings. (B) Single nucleotide substitutions downstream of the core binding element. “x” indicates the position of the substitutions; every nucleotide identity was assayed at each position. (Box) The core element. β-Galactosidase values are relative to the wild-type FBEa; error bars represent the standard deviation of six repetitions. The wild-type identity is labeled at each position. (C) Four-nucleotide substitutions downstream of the core binding element. Lowercase letters indicate the substitution; the core element is boxed. β-Galactosidase values are relative to the wild-type FBEa; error bars represent the standard deviation of four repetitions.
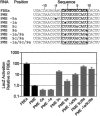
FIGURE 9.
The weak binding PME can be converted to a strong FBF-1 binding site. Substitutions changing the nucleotide identity from that of the PME to the FBEa are in lowercase; the core element is boxed. β-Galactosidase values are relative to the wild-type FBEa in the three-hybrid assay; error bars represent the standard deviation of four repetitions.
FIGURE 10.
New FBF-1 binding sites identified in a database using a reference sequence. (A) Summary of mutagenesis. A representation of the extended FBF-1 binding site; letter height indicates binding strength of the single mutant relative to other mutants at that position. (B) Search reference sequences. Reference sequences used to search the 3′ UTR database; arrow indicates increasing stringency, bold, the consensus used for the optimized search. Reference sequence abbreviations: “B” is C, G, or U; “D” is A, G, or U; “H” is A, C, or U; “M” is A or C; “N” is A, C, G, or U; “R” is A or G; “V” is A, C, or G; “W” is A or U; “Y” is C or U. (C) New binding sites. A sampling of predicted FBF-1 binding sites that interact at least as strongly as the PME; dashes (—) distinguish multiple binding sites in a single 3′ UTR. The entire sequence tested is shown; lowercase letters indicate substitutions introduced to increase expression in yeast; the core element is boxed. β-Galactosidase values are relative to the wild-type FBEa in the three-hybrid assay; error bars represent the standard deviation of three repetitions.
Similar articles
- A protein.protein interaction platform involved in recruitment of GLD-3 to the FBF.fem-3 mRNA complex.
Wu J, Campbell ZT, Menichelli E, Wickens M, Williamson JR. Wu J, et al. J Mol Biol. 2013 Feb 22;425(4):738-54. doi: 10.1016/j.jmb.2012.11.013. Epub 2012 Nov 15. J Mol Biol. 2013. PMID: 23159559 Free PMC article. - A Caenorhabditis elegans PUF protein family with distinct RNA binding specificity.
Stumpf CR, Kimble J, Wickens M. Stumpf CR, et al. RNA. 2008 Aug;14(8):1550-7. doi: 10.1261/rna.1095908. Epub 2008 Jun 25. RNA. 2008. PMID: 18579869 Free PMC article. - A single spacer nucleotide determines the specificities of two mRNA regulatory proteins.
Opperman L, Hook B, DeFino M, Bernstein DS, Wickens M. Opperman L, et al. Nat Struct Mol Biol. 2005 Nov;12(11):945-51. doi: 10.1038/nsmb1010. Nat Struct Mol Biol. 2005. PMID: 16244662 - Role of PUF-8/PUF protein in stem cell control, sperm-oocyte decision and cell fate reprogramming.
Datla US, Scovill NC, Brokamp AJ, Kim E, Asch AS, Lee MH. Datla US, et al. J Cell Physiol. 2014 Oct;229(10):1306-11. doi: 10.1002/jcp.24618. J Cell Physiol. 2014. PMID: 24638209 Review. - C. elegans star proteins, GLD-1 and ASD-2, regulate specific RNA targets to control development.
Lee MH, Schedl T. Lee MH, et al. Adv Exp Med Biol. 2010;693:106-22. doi: 10.1007/978-1-4419-7005-3_8. Adv Exp Med Biol. 2010. PMID: 21189689 Review.
Cited by
- Sequence-specific binding of a chloroplast pentatricopeptide repeat protein to its native group II intron ligand.
Williams-Carrier R, Kroeger T, Barkan A. Williams-Carrier R, et al. RNA. 2008 Sep;14(9):1930-41. doi: 10.1261/rna.1077708. Epub 2008 Jul 30. RNA. 2008. PMID: 18669444 Free PMC article. - The PUF binding landscape in metazoan germ cells.
Prasad A, Porter DF, Kroll-Conner PL, Mohanty I, Ryan AR, Crittenden SL, Wickens M, Kimble J. Prasad A, et al. RNA. 2016 Jul;22(7):1026-43. doi: 10.1261/rna.055871.116. Epub 2016 May 10. RNA. 2016. PMID: 27165521 Free PMC article. - Cooperativity in RNA-protein interactions: global analysis of RNA binding specificity.
Campbell ZT, Bhimsaria D, Valley CT, Rodriguez-Martinez JA, Menichelli E, Williamson JR, Ansari AZ, Wickens M. Campbell ZT, et al. Cell Rep. 2012 May 31;1(5):570-81. doi: 10.1016/j.celrep.2012.04.003. Cell Rep. 2012. PMID: 22708079 Free PMC article. - Selections that optimize RNA display in the yeast three-hybrid system.
Wurster SE, Maher LJ 3rd. Wurster SE, et al. RNA. 2010 Feb;16(2):253-8. doi: 10.1261/rna.1880410. Epub 2009 Dec 14. RNA. 2010. PMID: 20008486 Free PMC article. Review. - Puf mediates translation repression of transmission-blocking vaccine candidates in malaria parasites.
Miao J, Fan Q, Parker D, Li X, Li J, Cui L. Miao J, et al. PLoS Pathog. 2013;9(4):e1003268. doi: 10.1371/journal.ppat.1003268. Epub 2013 Apr 18. PLoS Pathog. 2013. PMID: 23637595 Free PMC article.
References
- Allain, F.H., Gubser, C.C., Howe, P.W., Nagai, K., Neuhaus, D., and Varani, G. 1996. Specificity of ribonucleoprotein interaction determined by RNA folding during complex formulation. Nature 380: 646–650. - PubMed
- Bernstein, D.S., Buter, N., Stumpf, C., and Wickens, M. 2002. Analyzing mRNA–protein complexes using a yeast three-hybrid system. Methods 26: 123–141. - PubMed
- Crittenden, S.L., Bernstein, D.S., Bachorik, J.L., Thompson, B.E., Gallegos, M., Petcherski, A.G., Moulder, G., Barstead, R., Wickens, M., and Kimble, J. 2002. A conserved RNA-binding protein controls germline stem cells in Caenorhabditis elegans. Nature 417: 660–663. - PubMed
- Dsouza, M., Larsen, N., and Overbeek, R. 1997. Searching for patterns in genomic data. Trends Genet. 13: 497–498. - PubMed
Publication types
MeSH terms
Substances
Grants and funding
- GM50942/GM/NIGMS NIH HHS/United States
- R01 GM050942/GM/NIGMS NIH HHS/United States
- R37 GM031892/GM/NIGMS NIH HHS/United States
- GM31892/GM/NIGMS NIH HHS/United States
- R01 GM031892/GM/NIGMS NIH HHS/United States
LinkOut - more resources
Full Text Sources
Other Literature Sources
Research Materials
