Activity-induced tissue oxygenation changes in rat cerebellar cortex: interplay of postsynaptic activation and blood flow - PubMed (original) (raw)
Activity-induced tissue oxygenation changes in rat cerebellar cortex: interplay of postsynaptic activation and blood flow
Nikolas Offenhauser et al. J Physiol. 2005.
Abstract
Functional neuroimaging relies on the robust coupling between neuronal activity, metabolism and cerebral blood flow (CBF), but the physiological basis of the neuroimaging signals is still poorly understood. We examined the mechanisms of activity-dependent changes in tissue oxygenation in relation to variations in CBF responses and postsynaptic activity in rat cerebellar cortex. To increase synaptic activity we stimulated the monosynaptic, glutamatergic climbing fibres that excite Purkinje cells via AMPA receptors. We used local field potentials to indicate synaptic activity, and recorded tissue oxygen partial pressure (P(tiss,O2)) by polarographic microelectrodes, and CBF using laser-Doppler flowmetry. The disappearance rate of oxygen in the tissue increased linearly with synaptic activity. This indicated that, without a threshold, oxygen consumption increased as a linear function of synaptic activity. The reduction in P(tiss,O2) preceded the rise in CBF. The time integral (area) of the negative P(tiss,O2) response increased non-linearly showing saturation at high levels of synaptic activity, concomitant with a steep rise in CBF. This was accompanied by a positive change in P(tiss,O2). Neuronal nitric oxide synthase inhibition enhanced the initial negative P(tiss,O2) response ('dip'), while attenuating the evoked CBF increase and positive P(tiss,O2) response equally. This indicates that increases in CBF counteract activity-induced reductions in P(tiss,O2), and suggests the presence of a tissue oxygen reserve. The changes in P(tiss,O2) and CBF were strongly attenuated by AMPA receptor blockade. Our findings suggest an inverse relationship between negative P(tiss,O2) and CBF responses, and provide direct in vivo evidence for a tight coupling between activity in postsynaptic AMPA receptors and cerebellar oxygen consumption.
Figures
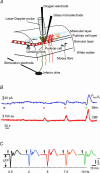
Figure 1. Recordings of _P_tiss,O2, neuronal activity and blood flow in rat cerebellar cortex
A, schematic three-dimensional drawing of experimental set-up, including neurones of interest and placement of stimulation and recording devices. A bi-polar electrode placed stereotaxically in the caudal part of the inferior olive stimulated climbing fibres (green) that give a monosynaptic excitatory input to Purkinje cells (red). Concurrent electrophysiological recordings (LFPs) were performed by a glass microelectrode at the level of the Purkinje cell layer. An oxygen microelectrode located at the same depth, simultaneously recorded changes in tissue oxygen tension (_P_tiss,O2). A specific characteristic of this modified Clark-type polarographic electrode is its built-in guard cathode, which promotes the long-term stability of oxygen measurements. Tip diameter ranged from 3 to 5 μm. CBF was recorded by LDF with a probe located in close apposition to the microelectrodes. B, shows original recordings of both _P_tiss,O2 (upper trace) and CBF (lower trace) in response to climbing fibre stimulation with increasing stimulation frequency. Coloured bars indicate stimulation periods (15 s) and frequencies (same colour code as in C). C, the corresponding averaged LFPs for each stimulation frequency, where LFP amplitudes tended to decrease with increasing frequencies. The double-headed arrow indicates the measured LFP amplitude for the 0.5-Hz stimulation. Time points of stimulation are marked by grey arrowheads. Examples are from the same animal as in Fig. 2.
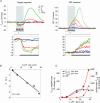
Figure 2. Frequency-dependent changes of _P_tiss,O2, CBF and LFP responses: original recording from one animal
A, superimposed _P_tiss,O2 and CBF responses (averages of four responses from one animal) to varying stimulation frequencies from 0.5 to 10 Hz. The _P_tiss,O2 response pattern ranged from monophasic decreases (0.5–5 Hz) to biphasic responses (7.5 and 10 Hz) where an initial decrease (negative P_tiss,O2 response) was followed by a tissue oxygenation overshoot (positive P_tiss,O2 response). The CBF response increased monotonically with increasing stimulation frequency. The inset boxes enlarge the responses during the stimulation period. The disappearance rate of oxygen in the tissue (−_k) during the initial phase of stimulation, was frequency dependent (left inset), as indicated by the increasing steepness of the initial negative slope. Tissue deoxygenation began before CBF started to rise. The grey bars, and the black lines at the bottom of the inset boxes indicate the 15-s stimulation period. B, shows a correlation plot between ΣLFP during stimulation (averaged LFP amplitude × stimulation frequency) and −_k. Colour coding is the same as in A. C, shows correlation plots between ΣLFP and evoked CBF, negative and positive _P_tiss,O2 responses.
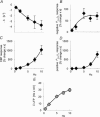
Figure 3. Frequency-dependency of _P_tiss,O2 and CBF dynamics
Stimulation-induced responses are plotted against stimulation frequencies (n = 10 rats). Data are averaged by frequency and illustrate the frequency dependency of the haemodynamic and oxygen responses. A, the disappearance rate of oxygen in the tissue (−k; initial slope of the negative _P_tiss,O2 response) increased with increasing stimulation frequency. B, a plot of the mean area of the negative _P_tiss,O2 response. The area of the negative _P_tiss,O2 response increased up to frequencies of 5 Hz and then levelled off. C and D, the CBF and positive _P_tiss,O2 responses showed an ongoing increase without signs of saturation. E, shows ΣLFP plotted against stimulation frequency. ΣLFP (expressing the overall level of synaptic activity) tends to saturate at frequencies above 5 Hz. The _x_-axis labels for C and D also apply for A and B. All values are given as mean ±
s.e.m.
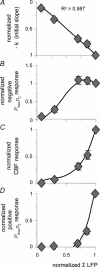
Figure 4. Correlation between accumulated synaptic activity and _P_tiss,O2 and CBF responses
Normalized values of evoked CBF and P_tiss,O2 responses are plotted against normalized values of ΣLFP (n = 10 rats). All responses were normalized to the corresponding 10-Hz response and were averaged and grouped by stimulation frequency. A, the disappearance rate of oxygen in the tissue (−_k) plotted against synaptic activity (ΣLFP) shows an inverse linear relationship, well fitted by a linear regression passing through the origin (P < 0.05). This suggests that oxygen consumption increases at all levels of synaptic activity. B, the correlation between ΣLFP and the area of the negative _P_tiss,O2 response demonstrated saturation of the negative _P_tiss,O2 response at high levels of synaptic activity. The CBF (C) and the positive _P_tiss,O2 response (D) both exhibited a non-linear rise over the range of induced synaptic activities without reaching saturation. C and D, indicate that synaptic activity, and thereby CBF, has to increase above a given threshold to evoke a _P_tiss,O2 overshoot. Note that the level of synaptic activity where the CBF response curve started to increase more steeply coincides not only with the point where a positive _P_tiss,O2 signal became evident but also with the point where the negative _P_tiss,O2 response started to level off. The _x_-axis label for D applies to all panels. Polynomial regression was used to illustrate the distribution of data in B_–_D. All values are given as mean ±
s.e.m.
Figure 5. Effect of attenuated CBF rise on _P_tiss,O2 responses and synaptic activity
Responses to climbing fibre stimulation at 10 Hz were compared before (CTR) and after
i.p.
application of the nNOS inhibitor 7-nitroindazol (7-NI; n = 8 rats). A, shows an example of _P_tiss,O2 and corresponding CBF responses before (black) and after application of 7-NI (green). Grey bars denote the stimulation period. The biphasic _P_tiss,O2 response at this frequency was calculated as negative and positive _P_tiss,O2 response area. B, 7-NI enlarged the negative _P_tiss,O2 response by ∼400% (P < 0.05) and reduced the positive _P_tiss,O2 response by ∼78% (P < 0.05). These changes accompanied the attenuation of the evoked CBF rise of ∼60% (P < 0.05) B, all values in B are given as mean ±
s.e.m.
C, demonstrates that the observed changes were not due to effects on synaptic activity, as ΣLFP was not significantly altered by 7-NI. C, left panel shows averaged LFPs before (black) and after (green) application of 7-NI from the same animal as in A. Time points of stimulation are marked by grey arrowheads. *P < 0.05.
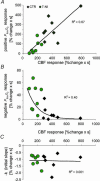
Figure 6. Tissue _P_O2 responses in relation to CBF increases before and after application of 7-NI
A, plotting the areas of positive _P_tiss,O2 responses to 10-Hz stimulations against corresponding CBF responses shows that small positive _P_tiss,O2 responses correspond to small increases in CBF obtained after 7-NI application (green circles), while large positive _P_tiss,O2 responses correspond to large increases in CBF obtained during control conditions (♦) (n = 8 rats). This indicates a linear relationship between positive _P_tiss,O2 signals and increases in CBF (linear regression analysis, P < 0.05). B, the areas of negative _P_tiss,O2 responses decayed exponentially with increasing magnitude of CBF responses (y_= 75.012e − 0.0069_x). C, in contrast to the positive and negative P_tiss,O2 responses, the disappearance rate of oxygen in the tissue (−_k) was independent of the magnitude of evoked CBF responses.
Figure 7. Effect of AMPA receptor blockade on synaptic transmission, and evoked _P_tiss,O2 and CBF responses
The effect of topically applied CNQX on responses evoked by climbing fibre stimulation at 10 Hz is illustrated (n = 8 rats). Responses obtained before (CTR), during (CNQX) and after wash out (Wash out) were compared. A, shows an example of _P_tiss,O2 and corresponding CBF responses before (black trace), during (red trace) and after washout of CNQX (grey trace). Grey bars denote the stimulation period. B, AMPA receptor blockade reversibly attenuated both phases of the _P_tiss,O2 response and the CBF increase (negative _P_tiss,O2 response area, −81%; positive _P_tiss,O2 response area, −84%; CBF response, −69%). All values in B are given as mean ±
s.e.m.
C, the concomitant inhibition of ΣLFP during AMPA receptor blockade (−69%, P < 0.05, right panel) indicated that the reduction of the _P_tiss,O2 responses in the presence of CNQX was due to reduced postsynaptic activity. C, left panel shows averaged LFPs before (black), during (red) and after wash out (grey) of CNQX from the same animal as in A. Time points of stimulation are marked by grey arrowheads. *P < 0.05 compared to CTR.
Figure 8. Effect of AMPA receptor blockade after pretreatment with 7-NI
CNQX (0.5 m
m
) was topically applied in five out of eight animals treated with 7-NI and responses evoked by climbing fibre stimulation at 10 Hz were compared. A, shows an example of _P_tiss,O2 and corresponding CBF responses from one animal under control conditions (black trace), after application of 7-NI (dark green), in the presence of 7-NI + CNQX (red) and after washout of CNQX (bright green). Grey bars denote the stimulation period. B, shows the averaged responses before (CTR) and after application of 7-NI (7-NI) and illustrates the temporary effect of CNQX (CNQX and Wash out). As 7-NI is an irreversible nNOS inhibitor, it cannot be washed out. Compared to 7-NI values, the negative _P_tiss,O2 response during application of CNQX was reduced by ∼94%. The already diminished positive _P_tiss,O2 and CBF responses were both further reduced by ∼91%. However, the decrease in the positive _P_tiss,O2 response did not reach significance. CNQX application attenuated the ΣLFP by 85% (compared to 7-NI; P < 0.05; data not shown). All CNQX effects were reversible with no significant differences to 7-NI. All values are given as mean ±
s.e.m.
*P < 0.05 compared to 7-NI.
Similar articles
- Modification of activity-dependent increases of cerebral blood flow by excitatory synaptic activity and spikes in rat cerebellar cortex.
Mathiesen C, Caesar K, Akgören N, Lauritzen M. Mathiesen C, et al. J Physiol. 1998 Oct 15;512 ( Pt 2)(Pt 2):555-66. doi: 10.1111/j.1469-7793.1998.555be.x. J Physiol. 1998. PMID: 9763643 Free PMC article. - Laminar analysis of activity-dependent increases of CBF in rat cerebellar cortex: dependence on synaptic strength.
Akgören N, Mathiesen C, Rubin I, Lauritzen M. Akgören N, et al. Am J Physiol. 1997 Sep;273(3 Pt 2):H1166-76. doi: 10.1152/ajpheart.1997.273.3.H1166. Am J Physiol. 1997. PMID: 9321803 - Cerebral blood flow increases evoked by electrical stimulation of rat cerebellar cortex: relation to excitatory synaptic activity and nitric oxide synthesis.
Akgören N, Dalgaard P, Lauritzen M. Akgören N, et al. Brain Res. 1996 Feb 26;710(1-2):204-14. doi: 10.1016/0006-8993(95)01354-7. Brain Res. 1996. PMID: 8963660 - Relationship of spikes, synaptic activity, and local changes of cerebral blood flow.
Lauritzen M. Lauritzen M. J Cereb Blood Flow Metab. 2001 Dec;21(12):1367-83. doi: 10.1097/00004647-200112000-00001. J Cereb Blood Flow Metab. 2001. PMID: 11740198 Review. - Cerebral blood flow response to functional activation.
Paulson OB, Hasselbalch SG, Rostrup E, Knudsen GM, Pelligrino D. Paulson OB, et al. J Cereb Blood Flow Metab. 2010 Jan;30(1):2-14. doi: 10.1038/jcbfm.2009.188. Epub 2009 Sep 9. J Cereb Blood Flow Metab. 2010. PMID: 19738630 Free PMC article. Review.
Cited by
- A new pathway for lactate production in the CNS.
Kasischke KA. Kasischke KA. J Physiol. 2008 Mar 1;586(5):1207-8. doi: 10.1113/jphysiol.2008.151373. J Physiol. 2008. PMID: 18310130 Free PMC article. No abstract available. - Polarographic Electrode Measures of Cerebral Tissue Oxygenation: Implications for Functional Brain Imaging.
Bartlett K, Saka M, Jones M. Bartlett K, et al. Sensors (Basel). 2008 Dec 2;8(12):7649-7670. doi: 10.3390/s8127649. Sensors (Basel). 2008. PMID: 27873951 Free PMC article. Review. - Coupling of neural activity to blood flow in olfactory glomeruli is mediated by astrocytic pathways.
Petzold GC, Albeanu DF, Sato TF, Murthy VN. Petzold GC, et al. Neuron. 2008 Jun 26;58(6):897-910. doi: 10.1016/j.neuron.2008.04.029. Neuron. 2008. PMID: 18579080 Free PMC article. - Imaging local neuronal activity by monitoring PO₂ transients in capillaries.
Parpaleix A, Goulam Houssen Y, Charpak S. Parpaleix A, et al. Nat Med. 2013 Feb;19(2):241-6. doi: 10.1038/nm.3059. Epub 2013 Jan 13. Nat Med. 2013. PMID: 23314058 - Extracellular levels of lactate, but not oxygen, reflect sleep homeostasis in the rat cerebral cortex.
Dash MB, Tononi G, Cirelli C. Dash MB, et al. Sleep. 2012 Jul 1;35(7):909-19. doi: 10.5665/sleep.1950. Sleep. 2012. PMID: 22754037 Free PMC article.
References
- Beitz AJ, Saxon D. Harmaline-induced climbing fiber activation causes amino acid and peptide release in the rodent cerebellar cortex and a unique temporal pattern of Fos expression in the olivo-cerebellar pathway. J Neurocytol. 2004;33:49–74. - PubMed
Publication types
MeSH terms
Substances
LinkOut - more resources
Full Text Sources
