Retrovirus envelope protein complex structure in situ studied by cryo-electron tomography - PubMed (original) (raw)
Retrovirus envelope protein complex structure in situ studied by cryo-electron tomography
Friedrich Förster et al. Proc Natl Acad Sci U S A. 2005.
Abstract
We used cryo-electron tomography in conjunction with single-particle averaging techniques to study the structures of frozen-hydrated envelope glycoprotein (Env) complexes on intact Moloney murine leukemia retrovirus particles. Cryo-electron tomography allows 3D imaging of viruses in toto at a resolution sufficient to locate individual macromolecules, and local averaging of abundant complexes substantially improves the resolution. The averaging of repetitive features in electron tomograms is hampered by a low signal-to-noise ratio and anisotropic resolution, which results from the "missing-wedge" effect. We developed an iterative 3D averaging algorithm that compensates for this effect and used it to determine the trimeric structure of Env to a resolution of 2.7 nm, at which individual domains can be resolved. Strikingly, the 3D reconstruction is shaped like a tripod in which the trimer penetrates the membrane at three distinct locations approximately 4.5 nm apart from one another. The Env reconstruction allows tentative docking of the x-ray crystal structure of the receptor-binding domain. This study thus provides 3D structural information regarding the prefusion conformation of an intact unstained retrovirus surface protein.
Figures
Fig. 3.
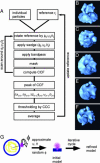
Summary of 3D averaging procedure. (A) Iterative “tomogram-matching” scheme. (B-F) Illustrations of the individual steps of reference preparation. For the subtomogram (for example, B), the reference is rotated into an orientation (ϕ, ψ, θ)(C). It is Fourier transformed, and a wedge-shaped function, corresponding to the imaging conditions, is multiplied (D). Back in real space, the reference and the subtomogram are masked (E), and the shifts (Δ_xi_, Δ_yi_, and Δ_zi_) are considered for the subtomogram. Both data are band-pass filtered (F) before subtraction of the mean value and normalization according to the standard deviation within the masked area. Eventually, the cross-correlation function (CCF) is computed. The peak of the CCF with respect to orientation and location (maximum cross-correlation coefficient CCCmax) determines the Eulerian angles and shifts for the next iteration i + 1. As a criterion for exclusion of particles, the height of CCCmax relative to average CCCmax can be used. The final step is the averaging of the aligned subtomograms, which includes correct weighting according to the data coverage in Fourier space. This average is used as a reference for iteration i + 1. (G) Approximate a priori determination of two of three Euler angles for initial reference. The initial reference is created by assuming that the Env particles are oriented perpendicular to the viral membrane, which fixes ψ and θ; the polar angle ϕ is chosen randomly initially.
Fig. 1.
Cyro-electron tomograms of MoMuLV. (A) Conventional transmission electron micrograph (0° tilt projection) of vitrified MoMuLV. (Bar, 100 nm.) The micrograph is taken at a defocus of 5 μm. (B)An x-y slice of a tomogram, 11 nm thick in z. Because the reconstruction incorporates the data of different views, SNR is clearly improved compared with the raw micrograph, which enables identification of the Env particles. At this magnification, Env complexes are visible as dots coating the viral membrane.
Fig. 2.
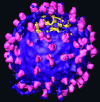
Surface rendered tomogram of an individual MoMuLV virion that possesses particularly many spikes. Env complexes (magenta) are located at the lipid surface of the virus (purple). The segmentation of the Env particles was performed interactively. The tomogram was denoised by using nonlinear anisotropic diffusion for visualization purposes (22).
Fig. 4.
Env structure visualized as x-y slices along the z axis (normal to the membrane) before (A) and after (B) imposing threefold along the z axis. The reconstructions are obtained from 1,114 individual Env subtomograms acquired at 5-μm defocus. The scale bar is equivalent to 10 nm, and each square (slice) corresponds to 0.55-nm thickness. The last z sections (bottom left to right) correspond to the viral membrane.
Fig. 5.
Final Env structure. (A and B) Isosurface representation of the resulting average at 4-μm defocus of Env as seen from the side (A) and the top (B). Manual segmentation of the viral membrane (purple) and the complex (magenta) was performed to visualize the complex. (C) Env visualized as in Fig. 4. (The scale bar corresponds to 10 nm.)
Fig. 6.
Stereoview of the proposed fitting of the RBD structure (2) into the electron density map of the Env trimer.
Similar articles
- Cryo-Electron Tomography and Subtomogram Averaging.
Wan W, Briggs JA. Wan W, et al. Methods Enzymol. 2016;579:329-67. doi: 10.1016/bs.mie.2016.04.014. Epub 2016 Jun 22. Methods Enzymol. 2016. PMID: 27572733 Review. - Native structure of a retroviral envelope protein and its conformational change upon interaction with the target cell.
Riedel C, Vasishtan D, Siebert CA, Whittle C, Lehmann MJ, Mothes W, Grünewald K. Riedel C, et al. J Struct Biol. 2017 Feb;197(2):172-180. doi: 10.1016/j.jsb.2016.06.017. Epub 2016 Jun 23. J Struct Biol. 2017. PMID: 27345930 Free PMC article. - Single particle and molecular assembly analysis of polyribosomes by single- and double-tilt cryo electron tomography.
Myasnikov AG, Afonina ZA, Klaholz BP. Myasnikov AG, et al. Ultramicroscopy. 2013 Mar;126:33-9. doi: 10.1016/j.ultramic.2012.12.009. Epub 2012 Dec 20. Ultramicroscopy. 2013. PMID: 23376404 - Cryo-electron tomographic structure of an immunodeficiency virus envelope complex in situ.
Zanetti G, Briggs JA, Grünewald K, Sattentau QJ, Fuller SD. Zanetti G, et al. PLoS Pathog. 2006 Aug;2(8):e83. doi: 10.1371/journal.ppat.0020083. PLoS Pathog. 2006. PMID: 16933990 Free PMC article. - Determining the structure of biological macromolecules by transmission electron microscopy, single particle analysis and 3D reconstruction.
Ruprecht J, Nield J. Ruprecht J, et al. Prog Biophys Mol Biol. 2001;75(3):121-64. doi: 10.1016/s0079-6107(01)00004-9. Prog Biophys Mol Biol. 2001. PMID: 11376797 Review.
Cited by
- Cellular and Structural Studies of Eukaryotic Cells by Cryo-Electron Tomography.
Weber MS, Wojtynek M, Medalia O. Weber MS, et al. Cells. 2019 Jan 16;8(1):57. doi: 10.3390/cells8010057. Cells. 2019. PMID: 30654455 Free PMC article. Review. - The cellular environment shapes the nuclear pore complex architecture.
Schuller AP, Wojtynek M, Mankus D, Tatli M, Kronenberg-Tenga R, Regmi SG, Dip PV, Lytton-Jean AKR, Brignole EJ, Dasso M, Weis K, Medalia O, Schwartz TU. Schuller AP, et al. Nature. 2021 Oct;598(7882):667-671. doi: 10.1038/s41586-021-03985-3. Epub 2021 Oct 13. Nature. 2021. PMID: 34646014 Free PMC article. - Visualizing membrane trafficking through the electron microscope: cryo-tomography of coat complexes.
Markova EA, Zanetti G. Markova EA, et al. Acta Crystallogr D Struct Biol. 2019 May 1;75(Pt 5):467-474. doi: 10.1107/S2059798319005011. Epub 2019 Apr 30. Acta Crystallogr D Struct Biol. 2019. PMID: 31063149 Free PMC article. - Cryo-electron microscopy in the fight against COVID-19-mechanism of virus entry.
Bodakuntla S, Kuhn CC, Biertümpfel C, Mizuno N. Bodakuntla S, et al. Front Mol Biosci. 2023 Oct 6;10:1252529. doi: 10.3389/fmolb.2023.1252529. eCollection 2023. Front Mol Biosci. 2023. PMID: 37867557 Free PMC article. Review. - Novel bifunctional single-chain variable antibody fragments to enhance virolysis by complement: generation and proof-of-concept.
Huber G, Bánki Z, Kunert R, Stoiber H. Huber G, et al. Biomed Res Int. 2014;2014:971345. doi: 10.1155/2014/971345. Epub 2014 Jan 12. Biomed Res Int. 2014. PMID: 24524088 Free PMC article.
References
- Eckert, D. M. & Kim, P. S. (2001) Annu. Rev. Biochem. 70, 777-810. - PubMed
- Colman, P. M. & Lawrence, M. C. (2003) Nature Rev. Mol. Cell Biol. 4, 309-319. - PubMed
- Fass, D., Harrison, S. C. & Kim, P. S. (1996) Nat. Struct. Biol. 3, 465-469. - PubMed
- Fass, D., Davey, R. A., Hamson, C. A., Kim, P. S., Cunningham, J. M. & Berger, J. M. (1997) Science 277, 1662-1666. - PubMed
Publication types
MeSH terms
Substances
LinkOut - more resources
Full Text Sources


