A standard curve based method for relative real time PCR data processing - PubMed (original) (raw)
A standard curve based method for relative real time PCR data processing
Alexey Larionov et al. BMC Bioinformatics. 2005.
Abstract
Background: Currently real time PCR is the most precise method by which to measure gene expression. The method generates a large amount of raw numerical data and processing may notably influence final results. The data processing is based either on standard curves or on PCR efficiency assessment. At the moment, the PCR efficiency approach is preferred in relative PCR whilst the standard curve is often used for absolute PCR. However, there are no barriers to employ standard curves for relative PCR. This article provides an implementation of the standard curve method and discusses its advantages and limitations in relative real time PCR.
Results: We designed a procedure for data processing in relative real time PCR. The procedure completely avoids PCR efficiency assessment, minimizes operator involvement and provides a statistical assessment of intra-assay variation. The procedure includes the following steps. (I) Noise is filtered from raw fluorescence readings by smoothing, baseline subtraction and amplitude normalization. (II) The optimal threshold is selected automatically from regression parameters of the standard curve. (III) Crossing points (CPs) are derived directly from coordinates of points where the threshold line crosses fluorescence plots obtained after the noise filtering. (IV) The means and their variances are calculated for CPs in PCR replicas. (V) The final results are derived from the CPs' means. The CPs' variances are traced to results by the law of error propagation. A detailed description and analysis of this data processing is provided. The limitations associated with the use of parametric statistical methods and amplitude normalization are specifically analyzed and found fit to the routine laboratory practice. Different options are discussed for aggregation of data obtained from multiple reference genes.
Conclusion: A standard curve based procedure for PCR data processing has been compiled and validated. It illustrates that standard curve design remains a reliable and simple alternative to the PCR-efficiency based calculations in relative real time PCR.
Figures
Figure 1
Noise filtering. Axes: vertical – fluorescence, horizontal – cycle number, A Source data, B Smoothing, C Baseline subtraction, D Amplitude normalization
Figure 2
Direct calculation of crossing points.
Figure 3
Expression of Cyclin B1 mRNA in breast cancer biopsies. The observed decrease of Cyclin B1 expression after treatment was expected in most but not all cases. Bars show actual 95% confidence intervals estimated by the described statistical procedure in a set of real clinical specimens (NB – these are confidence intervals for intra-assay PCR variation only).
Figure 4
Distribution of crossing points in PCR replicas. Axes: vertical – relative frequency (%), horizontal – crossing points. Histogram represents a typical crossing points' distribution in 96× replica (Plate 1 from Table 2). The Kolmogorov-Smirnov test has not revealed significant deviations from the Normal distribution. The red line shows a Normal fit.
Figure 5
Transformation of normal distribution through data processing. Axes: vertical – relative frequency (%), horizontal – results. Red lines show Normal fits. A: At CPs' CV 0.5% the deviations from normality were not detectable using the Kolmogorov-Smirnov test. B: At CPs' CV 1% the deviations from normality were not detectable in non-normalized values though moderate deviations were detectable in final results. C: At CPs' CV 2% deviations from normality were detectable in both non-normalized values and in final results.
Figure 6
Effect of staining with SYBR Green 1 on PCR gel. A: Before staining. B: After staining. Before electrophoresis SYBR Green1 was added to marker but not to samples.
Figure 7
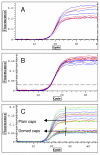
Effect of different factors on plateau position. A: More enzyme in blue than in red samples B: More primers in blue than in red samples C: Domed and plain caps
Figure 8
Optical factors affect the plateau scattering. SYBR Green real time PCR in frosted plates (green) and white plates (blue). Frosted plates cause increased plateau scattering because of inconsistent reflection and refraction (Reproduced from [18], with ABgene® permission).
Figure 9
Effect of amplitude normalization on standard curve.
Figure 10
Effect of amplitude normalization on plateau scattering in 96× replica. Axes: vertical – Fluorescence, horizontal – Cycle. Data for plate 3 from Table 2.
Figure 11
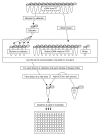
PCR set up.
Figure 12
Computer simulation of PCR data processing. Computer simulation of PCR data processing at 1% CV in crossing points (see Methods for details).
Similar articles
- Large scale real-time PCR validation on gene expression measurements from two commercial long-oligonucleotide microarrays.
Wang Y, Barbacioru C, Hyland F, Xiao W, Hunkapiller KL, Blake J, Chan F, Gonzalez C, Zhang L, Samaha RR. Wang Y, et al. BMC Genomics. 2006 Mar 21;7:59. doi: 10.1186/1471-2164-7-59. BMC Genomics. 2006. PMID: 16551369 Free PMC article. - Establishment of a real-time RT-PCR for the determination of absolute amounts of IGF-I and IGF-II gene expression in liver and extrahepatic sites of the tilapia.
Caelers A, Berishvili G, Meli ML, Eppler E, Reinecke M. Caelers A, et al. Gen Comp Endocrinol. 2004 Jun;137(2):196-204. doi: 10.1016/j.ygcen.2004.03.006. Gen Comp Endocrinol. 2004. PMID: 15158131 - Quantitative real-time PCR for cancer detection: the lymphoma case.
Ståhlberg A, Zoric N, Aman P, Kubista M. Ståhlberg A, et al. Expert Rev Mol Diagn. 2005 Mar;5(2):221-30. doi: 10.1586/14737159.5.2.221. Expert Rev Mol Diagn. 2005. PMID: 15833051 Review. - The real-time polymerase chain reaction.
Kubista M, Andrade JM, Bengtsson M, Forootan A, Jonák J, Lind K, Sindelka R, Sjöback R, Sjögreen B, Strömbom L, Ståhlberg A, Zoric N. Kubista M, et al. Mol Aspects Med. 2006 Apr-Jun;27(2-3):95-125. doi: 10.1016/j.mam.2005.12.007. Epub 2006 Feb 3. Mol Aspects Med. 2006. PMID: 16460794 Review.
Cited by
- Tubulin α-6 chain is a stably expressed reference gene in archival samples of normal oral tissue and oral squamous cell carcinoma.
Rentoft M, Hultin S, Coates PJ, Laurell G, Nylander K. Rentoft M, et al. Exp Ther Med. 2010 May;1(3):419-423. doi: 10.3892/etm_00000065. Epub 2010 May 1. Exp Ther Med. 2010. PMID: 22993556 Free PMC article. - OTUB1 overexpression in mesangial cells is a novel regulator in the pathogenesis of glomerulonephritis through the decrease of DCN level.
Zhang Y, Hu R, Wu H, Jiang W, Sun Y, Wang Y, Song Y, Jin T, Zhang H, Mao X, Zhao Z, Zhang Z. Zhang Y, et al. PLoS One. 2012;7(1):e29654. doi: 10.1371/journal.pone.0029654. Epub 2012 Jan 18. PLoS One. 2012. PMID: 22279542 Free PMC article. - CBX7 is involved in the progression of cervical cancer through the ITGβ3/TGFβ1/AKT pathway.
Tian P, Deng J, Ma C, Miershali A, Maimaitirexiati G, Yan Q, Liu Y, Maimaiti H, Li Y, Zhou C, Ren J, Ding L, Li R. Tian P, et al. Oncol Lett. 2023 Nov 13;27(1):14. doi: 10.3892/ol.2023.14147. eCollection 2024 Jan. Oncol Lett. 2023. PMID: 38028179 Free PMC article. - Drug repurposing screens reveal cell-type-specific entry pathways and FDA-approved drugs active against SARS-Cov-2.
Dittmar M, Lee JS, Whig K, Segrist E, Li M, Kamalia B, Castellana L, Ayyanathan K, Cardenas-Diaz FL, Morrisey EE, Truitt R, Yang W, Jurado K, Samby K, Ramage H, Schultz DC, Cherry S. Dittmar M, et al. Cell Rep. 2021 Apr 6;35(1):108959. doi: 10.1016/j.celrep.2021.108959. Epub 2021 Mar 23. Cell Rep. 2021. PMID: 33811811 Free PMC article. - The role of the Aspergillus nidulans high mobility group B protein HmbA, the orthologue of Saccharomyces cerevisiae Nhp6p.
Ámon J, Varga G, Pfeiffer I, Farkas Z, Karácsony Z, Hegedűs Z, Vágvölgyi C, Hamari Z. Ámon J, et al. Sci Rep. 2022 Oct 15;12(1):17334. doi: 10.1038/s41598-022-22202-3. Sci Rep. 2022. PMID: 36243791 Free PMC article.
References
- Muller PY, Janovjak H, Miserez AR, Dobbie Z. Processing of gene expression data generated by quantitative real-time RT-PCR. Biotechniques. 2002;32:1372–4, 1376, 1378-9. - PubMed
Publication types
MeSH terms
Substances
LinkOut - more resources
Full Text Sources
Other Literature Sources
Molecular Biology Databases


