Loss of Runx1 perturbs adult hematopoiesis and is associated with a myeloproliferative phenotype - PubMed (original) (raw)
. 2005 Jul 15;106(2):494-504.
doi: 10.1182/blood-2004-08-3280. Epub 2005 Mar 22.
Hirokazu Shigematsu, Zhe Li, Benjamin H Lee, Jennifer Adelsperger, Rebecca Rowan, David P Curley, Jeffery L Kutok, Koichi Akashi, Ifor R Williams, Nancy A Speck, D Gary Gilliland
Affiliations
- PMID: 15784726
- PMCID: PMC1895175
- DOI: 10.1182/blood-2004-08-3280
Loss of Runx1 perturbs adult hematopoiesis and is associated with a myeloproliferative phenotype
Joseph D Growney et al. Blood. 2005.
Abstract
Homozygous loss of function of Runx1 (Runt-related transcription factor 1 gene) during murine development results in an embryonic lethal phenotype characterized by a complete lack of definitive hematopoiesis. In light of recent reports of disparate requirements for hematopoietic transcription factors during development as opposed to adult hematopoiesis, we used a conditional gene-targeting strategy to effect the loss of Runx1 function in adult mice. In contrast with the critical role of Runx1 during development, Runx1 was not essential for hematopoiesis in the adult hematopoietic compartment, though a number of significant hematopoietic abnormalities were observed. Runx1 excision had lineage-specific effects on B- and T-cell maturation and pronounced inhibition of common lymphocyte progenitor production. Runx1 excision also resulted in inefficient platelet production. Of note, Runx1-deficient mice developed a mild myeloproliferative phenotype characterized by an increase in peripheral blood neutrophils, an increase in myeloid progenitor populations, and extramedullary hematopoiesis composed of maturing myeloid and erythroid elements. These findings indicate that Runx1 deficiency has markedly different consequences during development compared with adult hematopoiesis, and they provide insight into the phenotypic manifestations of Runx1 deficiency in hematopoietic malignancies.
Figures
Figure 1.
Inducible Runx1 excision in adult mice induces thrombocytopenia. (A) Schematic representation of Runx1 gene-targeting strategy used to flank exon 4 with LoxP-targeting sites. B indicates _Bam_HI; S, SspI; E4, Runt domain exon 4. (filled boxes) 5′ and 3′ targeting probes. (dashed arrows) _Bam_HI-digested genomic DNA fragments for wild-type (7.3-kb), Floxed (2.8-kb), and excised (2.5-kb) DNA detected with excision (Δ) probe (open boxes) located 3′ to the distal LoxP site. (B) Southern blot analysis of _Bam_HI-digested genomic DNA from bone marrow [B] and spleen [S] cells of representative mice killed at 14, 35, and 91 days after pIpC injection. The dose of pIpC is indicated. The blots are probed with Δ probe, which detects the Floxed (2.8-kb) and excised (2.5-kb) Runx1 alleles. Numbers indicate percentage excision. (C) Mean ± SD of total WBC counts, total red blood cell (RBC) counts, total platelet counts, percentage lymphocytes, and percentage neutrophils in PB of pIpC-treated _Runx1_F/F—Tg(_Mx1_-Cre) (red symbols) and _Runx1_F/F (black symbols) mice. Mice were bled 12 days before pIpC injection and 14, 21, 28, 35, 49, 91, 119, and 154 days after pIpC injection. The number of animals evaluated for each genotype at the respective time points is N (_Runx1_F/F—Tg(_Mx1_-Cre) = 14, 14, 12, 8, 10, 9, 8, 7 and 6; N (_Runx1_F/F) = 7, 5, 7, 7, 5, 7, 6, 6, and 6.
Figure 2.
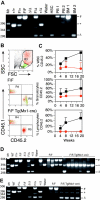
Stem cells from pIpC-treated _Runx1_F/F—Tg(_Mx1_-Cre) mice are reduced in competitive repopulation ability. (A) Ethidium bromide (EtBr)–stained 3% agarose gel of 3-primer PCR of Runx1 loci from sorted HSCs derived from fresh BM 17 weeks after pIpC (Table 1) and unfractionated BM and PB. 1 = _Runx1_F/F; 2 = _Runx_F/F—Tg(_Mx1_-Cre). Mr = 1-kb ladder, sizes indicated (bp). Control samples include tail DNA from Runx1+/+, _Runx1_F/+, and Runx1 F/F mice and from _Runx1_Δ/Δ, _Runx1_F/Δ, and Runx1+/Δ embryos. _Runx1_Δ alleles were generated by mating _Runx1_F/F mice to Tg(EIIa-Cre) mice and intercrossing _Runx1_F/Δ mice. (B) Composite showing gating strategy and CD45.1/CD45.2 staining of PB from representative mice that underwent transplantation with _Runx1_F/F or _Runx1_F/F—Tg(_Mx1_-Cre) and competitor marrow 8 weeks after transplantation. Green indicates lymphocytic (R2), and red indicates granulocytic (R3) fractions based on scatter gating (SSC, side scatter; FSC, forward scatter). Gate assignments were confirmed by back-gating of control stainings with Gr1+–, Mac1+–, CD3+–, T-cell receptor β (TCRβ+)–, CD19+–, or B220+–stained PB (not shown). The percentage contribution to the granulocytic and lymphocytic lineages of PB from each marrow isotype (CD45.1/CD45.2) was determined. (C) Plotted is the mean (±SD) percentage contribution of donor-derived CD45.2+ cells in PB from mice that underwent transplantation with _Runx1_F/F—Tg(_Mx1_-Cre) (red symbols; n = 6) or _Runx1_F/F (black symbols; n = 6) and competitor bone marrow to total WBCs, granulocytes, and lymphocytes of recipient mice at 4, 8, and 19 weeks after transplantation. Two of 8 mice receiving _Runx1_F/F—Tg(_Mx1_-Cre) marrow that failed to show contribution of CD45.2+ marrow to PB of recipient mice at any time point are excluded. (D) Nineteen weeks after transplantation, EtBr-stained 3% agarose gel of 3-primer PCR of Runx1 loci of BM from mice that underwent competitive transplantation. (E) EtBr-stained 3% agarose gel of 3-primer PCR of Runx1 loci from BM of mice that underwent transplantation without competitor marrow.
Figure 3.
Lymphoid development is inhibited in _Runx1_-excised mice. (A) Representative B220/CD19 and B220/CD43 staining of BM from _Runx1_F/F and _Runx1_F/F—Tg(_Mx1_-Cre) mice. CD43 staining is shown for cells gated as IgM–NKK1.1–Lin–. Numbers indicate percentage of cells gated in each respective quadrant. (B) EtBr-stained 3% agarose gels with 3-primer PCR products of Runx1 loci in PB, spleen (Sp), BM, and thymocytes (Th) of mice 154 days after pIpC. Genotypes are as indicated. Control samples are as in Figure 2. The primers do not amplify a product from the Runx1 rd allele. (C) Shown are CD4 and CD8 staining from representative animals of genotypes, Runx1 F/+, _Runx1_F/rd, and _Runx1_F/rd—Tg(_Mx1_-Cre). Numbers indicate percentage of cells gated in each respective quadrant. (D) Shown are CD25 and CD44 staining of CD45.2+CD4–CD8– gated thymocytes from representative animals, as in panel C. (E) Composite of high-speed flow cytometric analysis of BM from representative _Runx1_F/F and _Runx1_F/F—Tg(_Mx1_-Cre) mice. Numbers indicate percentages of total BM for indicated populations. Gated populations indicated include IL-7Rα+Lin– (R1), IL-7Rα+Lin+ (R2) (which includes immature B cells), and CLP (R3), as indicated in Table 1. PI indicates propidium iodide.
Figure 4.
Megakaryocyte maturation is inefficient in pIpC-treated _Runx1_-excised mice. BM from representative (A) _Runx1_F/F and (B) _Runx1_F/F—Tg(_Mx1_-Cre) mice 143 days after pIpC injection shows an absence of normal megakaryocytes in _Runx1_-excised mice (hematoxylin and eosin [H&E] staining; original magnification, × 600). (C) BM from representative _Runx1_F/F—Tg(_Mx1_-Cre) recipient mice 98 days after transplantation (H&E; original magnification, × 600). (A-C) Yellow arrows indicate representative megakaryocytes. Red and green arrowheads indicate representative erythroid and myeloid elements, respectively. Sections demonstrate a notable absence of megakaryocytes and an increased ratio of maturing myeloid-to-erythroid forms in _Runx1_-excised versus nonexcised marrows. (D) Histograms depicting number of cultured _Runx1_F/F and _Runx1_F/F—Tg (_Mx1_-Cre) bone marrow cells stained with propidium iodide to show ploidy. Colors indicate CD41 gates: green, CD41+; red, CD41–. (E, left) Plotted are mean ± SD numbers of acetylcholinesterase-positive colonies per 5 × 10⁴ BM cells plated from pIpC-treated _Runx1_F/F (□) and _Runx1_F/F—Tg(_Mx1_-Cre) (▪) mice. Results shown are for 3 experiments performed in quadruplicate. 1 and 3, fresh marrow; 2, previously frozen marrow. (Right) Plotted is the average fold increase for _Runx1_F/F—Tg(_Mx1_-Cre) (▪) relative to _Runx1_F/F (□) in the 3 experiments (P ≤ .034). Representative megakaryocyte colonies from (F) _Runx1_F/F and (G) _Runx1_F/F—Tg(_Mx1_-Cre) mice show acetylcholinesterase staining (brown) of megakaryocytic cells (original magnification, × 100).
Figure 5.
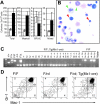
Mature and progenitor myeloid cell populations are expanded in pIpC-treated _Runx1_-excised mice. (A) Plotted are the mean ± SD of total (P < .05), myeloid (P < .05), BFU-E (P = .5), and mixed-lineage colonies (P = <.05) per 2 × 10⁴ BM cells plated in vitro from pIpC-treated _Runx1_F/F (□) and _Runx1_F/F—Tg(_Mx1_-Cre) (▪) mice. Results are the average of 3 experiments performed in duplicate. (B) Representative cytospin from mixed-lineage colony derived from _Runx1_F/F—Tg(_Mx1_-Cre) BM (Wright-Giemsa staining; original magnification, × 600). Red arrowheads indicate representative erythroid elements. Green arrowheads denote myeloid and monocytic forms. (C) Representative EtBr-stained 3% agarose gel of Runx1 PCR products from single GM or mixed-lineage colonies derived from _Runx1_F/F—Tg(_Mx1_-Cre) (lanes 1-20) and _Runx1_F/F (lanes 21-25) mice. Of 70 _Runx1_F/F—Tg(_Mx1_-Cre) colonies evaluated, 9 (12.8%) failed to show any amplification, 5 of 61 (8.2%) indicated partial excision, and 56 of 61 (91.8%) were completely excised. Tail and embryo genomic DNA controls are as indicated. (D) Gr1 and Mac1 staining of BM from representative CXB6F1 mice 154 days after pIpC induction. Numbers indicate percentages of cells gated in each respective quadrant.
Figure 6.
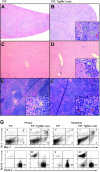
_Runx1_-excised mice display myeloid expansion in spleen and liver. Spleen (A-B) and liver (C-D) sections from representative (A,C) _Runx1_F/F and (B,D) _Runx1_F/F—Tg(_Mx1_-Cre) mice 143 days after pIpC (H&E; original magnification, ×100). Insets' original magnification, × 600. (E-F) Spleen sections from representative mice 14 weeks after transplantation with (E) _Runx1_F/F and (F) _Runx1_F/F—Tg(_Mx1_-Cre) marrow (H&E; original magnification, × 100). Insets' original magnification, ×600. (A-F) Yellow arrows indicate representative lymphocytes. Red and green arrowheads indicate representative erythroid and myeloid elements, respectively. Sections demonstrate the presence of extramedullary hematopoiesis in the liver and splenic red pulp in _Runx1_-excised mice, absent in nonexcised control animals. (G) Gr1/Mac1 and CD45.2/Ter119 staining of splenocytes of indicated genotype from representative primary mice or mice that underwent transplantation. Numbers indicate percentage of cells gated in each respective quadrant.
Similar articles
- Role of RUNX1 in adult hematopoiesis: analysis of RUNX1-IRES-GFP knock-in mice reveals differential lineage expression.
Lorsbach RB, Moore J, Ang SO, Sun W, Lenny N, Downing JR. Lorsbach RB, et al. Blood. 2004 Apr 1;103(7):2522-9. doi: 10.1182/blood-2003-07-2439. Epub 2003 Nov 20. Blood. 2004. PMID: 14630789 - Runx1/AML-1 ranks as a master regulator of adult hematopoiesis.
Ichikawa M, Asai T, Chiba S, Kurokawa M, Ogawa S. Ichikawa M, et al. Cell Cycle. 2004 Jun;3(6):722-4. Epub 2004 Jun 28. Cell Cycle. 2004. PMID: 15213471 Review. - Haploinsufficiency of Runx1 results in the acceleration of mesodermal development and hemangioblast specification upon in vitro differentiation of ES cells.
Lacaud G, Kouskoff V, Trumble A, Schwantz S, Keller G. Lacaud G, et al. Blood. 2004 Feb 1;103(3):886-9. doi: 10.1182/blood-2003-06-2149. Epub 2003 Oct 2. Blood. 2004. PMID: 14525762 - Runx1 is required for zebrafish blood and vessel development and expression of a human RUNX1-CBF2T1 transgene advances a model for studies of leukemogenesis.
Kalev-Zylinska ML, Horsfield JA, Flores MV, Postlethwait JH, Vitas MR, Baas AM, Crosier PS, Crosier KE. Kalev-Zylinska ML, et al. Development. 2002 Apr;129(8):2015-30. doi: 10.1242/dev.129.8.2015. Development. 2002. PMID: 11934867 - Core binding factor genes and human leukemia.
Hart SM, Foroni L. Hart SM, et al. Haematologica. 2002 Dec;87(12):1307-23. Haematologica. 2002. PMID: 12495904 Review.
Cited by
- USP4 regulates ribosome biogenesis and protein synthesis for hematopoietic stem cell regeneration and leukemia progression.
Liu B, Zhang X, Zhou Y, Liu H, Wang Z, Fu Y, Gao Q, Cheng X, Sun Q, Ju Z. Liu B, et al. Leukemia. 2024 Nov;38(11):2466-2478. doi: 10.1038/s41375-024-02338-z. Epub 2024 Sep 12. Leukemia. 2024. PMID: 39266638 - CDK9 phosphorylates RUNX1 to promote megakaryocytic fate in megakaryocytic-erythroid progenitors.
Kwon N, Lu YC, Thompson EN, Mancuso RI, Wang L, Zhang PX, Krause DS. Kwon N, et al. Blood. 2024 Oct 24;144(17):1800-1812. doi: 10.1182/blood.2024023963. Blood. 2024. PMID: 39102635 - Runx1 is sufficient but not required for cardiomyocyte cell-cycle activation.
Akins KA, Flinn MA, Swift SK, Chanjeevaram SV, Purdy AL, Buddell T, Kolell ME, Andresen KG, Paddock S, Buday SL, Veldman MB, O'Meara CC, Patterson M. Akins KA, et al. Am J Physiol Heart Circ Physiol. 2024 Aug 1;327(2):H377-H389. doi: 10.1152/ajpheart.00782.2023. Epub 2024 Jun 7. Am J Physiol Heart Circ Physiol. 2024. PMID: 38847758 Free PMC article. - Novel Germline RUNX1 Mutation Associated with Familial Thrombocytopenia as well as B-Acute Lymphoblastic Leukemia: A Case Report and Review of the Literature.
Karki N, Savage N, Kutlar A. Karki N, et al. Case Rep Oncol. 2021 Mar 12;14(1):439-445. doi: 10.1159/000512016. eCollection 2021 Jan-Apr. Case Rep Oncol. 2021. PMID: 38352275 Free PMC article. - Multi-lineage Differentiation from Hematopoietic Stem Cells.
Wang X, Liu S, Yu J. Wang X, et al. Adv Exp Med Biol. 2023;1442:159-175. doi: 10.1007/978-981-99-7471-9_10. Adv Exp Med Biol. 2023. PMID: 38228964 Review.
References
- North T, Gu TL, Stacy T, et al. Cbfa2 is required for the formation of intra-aortic hematopoietic clusters. Development. 1999;126: 2563-2575. - PubMed
- Cai Z, de Bruijn M, Ma X, et al. Haploinsufficiency of AML1 affects the temporal and spatial generation of hematopoietic stem cells in the mouse embryo. Immunity. 2000;13: 423-431. - PubMed
- Cameron S, Taylor DS, TePas EC, Speck NA, Mathey-Prevot B. Identification of a critical regulatory site in the human interleukin-3 promoter by in vivo footprinting. Blood. 1994;83: 2851-2859. - PubMed
- Otto F, Lubbert M, Stock M. Upstream and downstream targets of RUNX proteins. J Cell Biochem. 2003;89: 9-18. - PubMed
- de Bruijn MF, Speck NA. Core-binding factors in hematopoiesis and immune function. Oncogene. 2004;23: 4238-4248. - PubMed
Publication types
MeSH terms
Substances
LinkOut - more resources
Full Text Sources
Other Literature Sources
Molecular Biology Databases
Miscellaneous


